
SLIDE 1
Council of Supply Chain Management Professionals
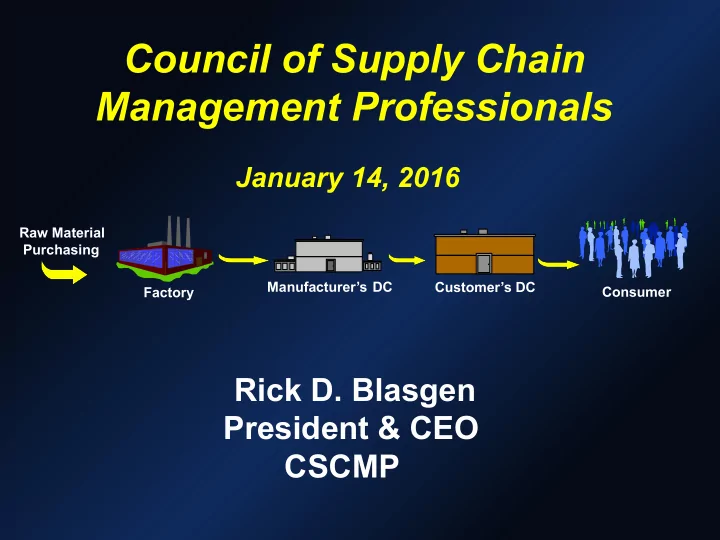
Raw Material Purchasing Factory Manufacturer’s DC Customer’s DC Consumer
Rick D. Blasgen
President & CEO CSCMP
January 14, 2016
Council of Supply Chain Management Professionals January 14, 2016 - - PowerPoint PPT Presentation
Council of Supply Chain Management Professionals January 14, 2016 Raw Material Purchasing Manufacturers DC Customers DC Consumer Factory Rick D. Blasgen President & CEO CSCMP What is a Supply Chain? A Typical Supply Chain
Council of Supply Chain Management Professionals
Raw Material Purchasing Factory Manufacturer’s DC Customer’s DC Consumer
Rick D. Blasgen
President & CEO CSCMP
January 14, 2016
What is a Supply Chain?
Technologies
Storage Manufacturer Storage Distributor Retailer End User Supplier
People Processes
Product Sourcing Manufacture Storage Storage Distributor Retailer Customer Order Receipt
Logistics Costs $1.356 t $1. 406 t $1.449 t 3.0% % of GDP 8.4% 8.4% 8.3% 1.2% Trans Costs $847 b $885 b $917 b 3.6%
Metric 2012 2013 2014 %
US State of Logistics
Transportation = 63%
spend!
US Business Logistics Costs
1.20 1.34 1.42 1.36 1.12 1.23 1.31 1.36 1.41 1.45 2005 2006 2007 2008 2009 2010 2011 2012 2013 2014
$ Trillions
industry since the Great Recession.
period of economic growth higher than 3% per quarter was from 2003 through 2005, when GDP grew faster than 4% in five out of ten quarters.
unemployment in falling, real net income and household net worth are inching up, inflation is low to moderate, and gas prices are tumbling.
Economy and Freight Logistics Had A Banner Year in 2014
Industrial Production Was Strong in 2014
Source: Federal Reserve Bank of St. Louis
96 98 100 102 104 106 108 2013 2014 2015
Industrial Production
Index 2007=100
Inventories Growth Slowed in 2014
Source: US Department of Commerce, Census Bureau
350 400 450 500 550 600 650 700 750 800
1Q06 1Q07 1Q08 1Q09 1Q10 1Q11 1Q12 1Q13 1Q14 1Q15
Millions of Dollars
Private Inventories
Retail trade Wholesale trade Manufacturing
The Inventory to Sales Ratio Rising Rapidly
Source: US Department of Commerce, Census Bureau
1.20 1.25 1.30 1.35 1.40 1.45 1.50
Recap of Inventory Carrying Costs
for the first half of the year and then gradually built to .11% in December.
1.2% in 2014 because of the growth in inventories.
Retail E-Commerce Sales
Source: Statista, http://www.statista.com/statistics/273424/retail-e-commerce-sales-in-the-united-states
$237 $211 $186 $162 $142 $130 $130 $123 $102 $82 $67 $53 $42 50 100 150 200 250 2014 2013 2012 2011 2010 2009 2008 2007 2006 2005 2004 2003 2002
Sales in Billion Dollars
Order from Anywhere Fulfill from Anywhere
Customer Call Center Tablet/Mobile Web Site Brick and Mortar Stores Catalogs Flash Sales Pop-Up Stores Outlet Locations Retail DC(s) eCommerce DC(s) Brick and Mortar Stores Kiosk
There are more mobile devices on Earth than people.
65% of U.S. shoppers
research products and services on a PC and make a purchase in- store Mobile internet usage
internet usage.
40% of shoppers
consult 3 or more channels before purchase, compared to
10% in 2002.
Talk about uber- connected: 75% of Americans bring their phones to the bathroom.
71% of mobile browsers
expect web pages to load almost as quickly or faster as web pages on their desktop computers. Nearly 40% of U.S. mobile phone owners will become mobile phone shoppers by
2017. 74% of consumers will
wait 5 seconds for a web page to load on their mobile device before abandoning the site. Retailers’ apps take up the most of consumers’ time at
27%, followed by online
marketplace at 20%, purchase assistant at 17%, price comparison at 14%, and daily deals at 13%.
46% of consumers are
unlikely to return to a mobile site if it didn’t work property during their last visit.
Truck Industry Recap
3.5%, meaning rates were very close to flat again.
times during the 2nd and 3rd quarters.
highest in eight years.
less have been hardest hit by required
390 declared bankruptcy in the first quarter of 2014 alone.
Railroad Industry Recap
grew 4.7%.
fuel was down 5.7% in 2014, dropping fuel as a percent of operating expenses 1.3% to 21.2%
Source: Individual port reports
US Container Shipments Recover in 2014
Port 2014 TEUs 2013 TEUs Percent Change Los Angeles 8,340,065 7,868,582 6.0% Long Beach 6,820,806 6,730,573 1.3% New York 5,772,303 5,467,347 5.6% Seaport Alliance* 3,427,561 3,456,161
Savannah 3,346,024 3,034,014 10.3% Oakland 2,394,069 2,346,528 2.0% Norfolk 2,393,038 2,223,532 7.6% Houston 1,958,251 1,952,122 0.3% Charleston 1,791,978 1,601,367 11.9%
*Ports of Seattle and Tacoma
Panama Canal Expansion plans include dredging and new locks
– 50%+ the number of TEU’s per ship – Fuel savings of 35% per container
– Closer proximity to U.S. population centers – Availability of less expensive real estate – Aggressive business and economic incentives – Non-union, lower cost labor
ships – Post-Panamax vessels = 16% of worlds container fleet today – Expected to grow to 62% by 2030 and dominate in future*
Impact of Panama Canal expansion
Logistics Costs have risen 120%
Average annual increase = $32b 2014 increase was $43b
Since 1990…
As a % of GDP, Logistics expense went from 11.0% to 8.3%, a reduction of 25%
Also….
Global Comparison of Logistics Expenditures
Asia 17% GDP China 18% GDP Europe 13% GDP India 13% GDP Japan 11% GDP Mexico 14% GDP Economy
Higher Output--GDP Better use of resources Multi-use Infrastructure
Businesses
Market Access Market Integration Cost Efficiency
Consumers
More Goods and Services Wider Availability Lower Prices/Income
Functional Orientation
Logistics Supply Chain Management- We became Global!
1950 1970 1980 1990 2000 1960 Beyond Focus
More Attention From Senior Management More Attention From Senior Management
Evolutionary Perspective
Wal-Mart's supply chain management success is improving productivity in the United States: The effects of the company's supply chain
innovations on the retail industry led to a 3.1 percent decline in overall consumer prices.
Consumers spent $263 billion LESS than
they would have if Wal-Mart were not around! That translates to $895 per person, or $2,329 per household.
When Supply Chains Work Well
A study by Georgia Tech showed that a company’s stock price drops 8% when the company experiences a glitch in its supply chain. A study at Miami University of Ohio showed that when a company adopts a new supply chain innovation the company’s stock price increases.
A study by Bain & Company showed that companies employing sophisticated supply chain methods enjoyed 12 times greater profit than companies with unsophisticated methods.
Wall Street: New found respect for SCM. In one SCM MBA program in the US, 21/32 grads received job offers from Investment Banking firms because of the importance of SCM to their clients.
SCM Has Strategic Profit Impact
Transparency!
Revenue Cash Flow Profitability Market Share
What keeps the CEO up at night?
$30 $145
pressure of dealing with global partners, suppliers and competition. Culture and geopolitical issues.
we scale?
Manufacturing “Finding a home in the USA”
traditional 8 hour workday still make sense?
success of a company’s supply chain
that contribute to supply chain value
Chain Management.
– Watching industry dynamics – Logistics industry represents almost 10% of the economy
a “cost to be managed”. It’s a driving force in modern business!
What does this all mean?
US Third Party Logistics Market
Source: Armstrong & Associates, Inc.
103.7 113.6 119.0 127.0 107.1 127.3 133.8 141.8 146.4 157.2 166.1
20 40 60 80 100 120 140 160 180
$ Billions
3PL Gross Revenues
Why is Risk Management important?
natural disasters than Africa, 25X more likely than Europe or North America
in Asia
past 30 years
natural disasters every year!
POLITICAL CHANGE UNIONIZATION SHIFTING WAGES INFRASTRUCTURE CHALLENGES EARTHQUAKES TYPHOONS WILDFIRES PROTESTS YOUNG, MOBILE ORGANIZATION LABOR STRIKES
Challenge as a Way of Life
Examine the infrastructure
Move fixed costs to variable - ZOG Invest – people, technology, process – or be left behind!
Sales
minus
Cost of Goods Sold Gross Margin Variable Expenses Fixed Expenses Total Expenses
Net Profit
Customer service level
Inventory
plus
Accounts Receivable
plus
Fixed Assets
Total Assets
divided by
Return
Assets
Just enough for desired service level Fast order cycle time Right product, no damage Effective use of logistics assets/outsourcing Optimal network
Financial Dimensions of SCM
Logistics efficiency; Procurement savvy Logistics efficiency Optimal network
minus
Using Logistics assets effectively and efficiently plus
37
The 45-member Advisory Committee on Supply Chain Competitiveness was formed to provide the Secretary of Commerce with detailed advice
Subcommittees Trade and Competitiveness Freight Policy and Movement Information Technology and Data Finance and Infrastructure Regulatory Workforce Development
Looking Ahead
and grow; the global economy will continue to lag.
Capacity, capacity, capacity!
the short run.
uncertain capacity availability.
Collaboration
Collaboration – “To cooperate with an enemy that has invaded your country”
Learn from Two of the World’s Most Influential Leaders in the Supply Chain Business Today
HOWARD SCHULTZ chairman, president, and chief executive
Starbucks DAVE CLARK senior vice president
customer service Amazon
CSCMP’s 2015 Annual Cnference September 27-30 San Diego, California USA
Highlights
Starbucks
exceeding expectations of customers, partners (employees) and the community.
execution if the culture isn’t positioned to support it.
business success…Don’t look at HR and Supply Chain as the last thing; look at them as the first thing.”
Highlights
Amazon
combination.
as if the innovation was being announced and work back to the customer requirements.
app – Uber for delivery.
later.
Art or Science?
What are the skill development needs of companies today?
Traditional Supply Chain Functional Career Path
Demand/Supply Planning
Global Logistics
Manufacturing Procurement
Executive Level Senior Level Advisory Level Staff Level Entry Level
Fulfillment
Corporate Executive Level
Leading Edge SCM Career Path
Demand/Supply Planning
Global Logistics
Manufacturing Procurement
SCM Consulting Level SCM
SCM Advisory Level ISC Staff Level ISC Entry Level
Fulfillment
Supply Chain Management
Experiences outside of ISC
The Future of Supply Chain Professionals
Inventory Management Transportation Warehousing Materials Planning Production Planning & Manufacturing Customer Service Procurement
Proficient competencies
Must have excellent interpersonal skills Ability to sustain collaborative relationships
1963 1985 2004
Established as the National Council
Management Council of Logistics Management Council of Supply Chain Management Professionals
50
EDUCATION RESEARCH CONNECTIONS NETWORKING CAREER RESOURCES
CSCMP – What We Deliver
ADVANCE YOUR CAREER WITH CSCMP’S SCPRO™ CERTIFICATION Three level certification includes:
Supply Chain Concierge Service Join the Community at cscmp.org
CSCMP’s Evolving Role
Connect, Educate and Develop the world’s Supply Chain Professionals!
Procurement
Marketing
Manufacturing
Information Tech
Suppliers Customers
SCM Pro
SCM Conducts a Symphony We matter!
Sales
Peter Drucker “If people are committed to maintaining yesterday, they are not available to create tomorrow”
Innovation! Be Creative in your Response to Supply Chain Problems
Transportation remains the crucial link !
Rail/Intermodal and Trucking are vital, and will continue to be so. More than ever before, “shippers” are working
productive. Let’s all do that and maximize the infrastructure use! We can fight it out on the shelf!
Summary
growth vehicle – a revenue generating engine.
economies.
functional skills and a global mindset to maximize
We have witnessed a rapid pace of change in Logistics/SCM operations in 50 years. Our greatest challenges lie ahead as we deal with security, constraints, harnessing technology and learning how to effectively collaborate and share risks and rewards.
You think you’re having a bad day!
Our Challenge……..
It will not be easy, but . . . It can happen.