SLIDE 1
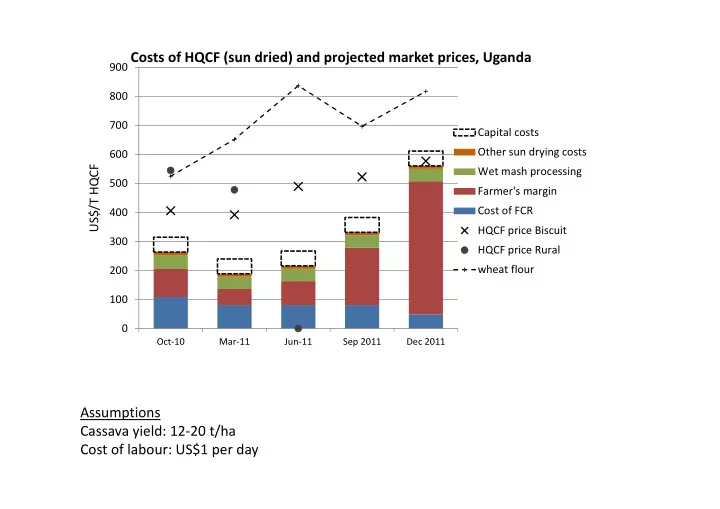
Assumptions Cassava yield: 12‐20 t/ha Cost of labour: US$1 per day
100 200 300 400 500 600 700 800 900
Oct‐10 Mar‐11 Jun‐11 Sep 2011 Dec 2011
US$/T HQCF
Costs of HQCF (sun dried) and projected market prices, Uganda
Capital costs Other sun drying costs Wet mash processing Farmer's margin Cost of FCR HQCF price Biscuit HQCF price Rural wheat flour
SLIDE 2
Assumptions Cassava yield: 15 t/ha (was 12t/ha) Cost of labour: US$2.2 per day
100 200 300 400 500 600 700 800 Oct 2010 Mar 2011 Jun 2011 Sep 2011 Dec 2011
US$/T HQCF Costs of HQCF (sun dried) and projected market prices, Tanzania
Capital costs Other sun drying costs Wet mash processing Farmer's margin Cost of FCR HQCF price Bread HQCF price Plywood/packaging HQCF price Rural wheat flour
SLIDE 3
Assumptions Cassava yield: 18 t/ha (was 16 t/ha) Cost of labour: US$1 per day
100 200 300 400 500 600 700 Oct 2010 Feb 2011 Jun 2011 Sep 2011 Dec 2011
US$/T HQCF
Costs of (sun‐dried) HQCF and projected market prices, Malawi
Capital costs Other sun drying costs Wet mash processing Farmer's margin Cost of FCR HQCF price Bread HQCF price Rural market
SLIDE 4
Assumptions Cassava yield: 23 t/ha Cost of labour: US$1 per day
100 200 300 400 500 600 700 800 900 1,000 Oct 2010 Feb 2011 Jun 2011 Sep 2011 Dec 2011
US$/T HQCF
Costs of (flash‐dried) HQCF and projected market prices, Malawi
capital costs Other factory costs Diesel Processor's gross margin Wetcake processing Farmer's gross margin Cost of FCR HQCF price Paperboard HQCF price Other HQCF price rural markets wheat flour price
SLIDE 5
Assumptions Cassava yield: 12 t/ha Cost of labour: US$3.57 per day
‐100 100 200 300 400 500 600 700 800 Oct 2010 Mar 2011 Jun 2011 Sep 2011 Dec 2011
US$/T HQCF
Costs of HQCF (flash dried) and projected market prices, Ghana
capital costs Other factory costs Diesel WMP's net margin Wet mash processing Farmer's net margin Cost of FCR HQCF price Bread/Biscuit HQCF price Plywood/packaging HQCF price Other
SLIDE 6
Assumptions Cassava yield: 12 t/ha Cost of labour: US$3.57 per day
100 200 300 400 500 600 Oct 2010 Mar 2011 Jun 2011 Sep 2011 Dec 2011
US$/T HQCF
Costs of HQCF (sun dried) and projected market prices, Ghana
Capital costs Other sun drying costs Wet mash processing Farmer's margin Cost of FCR HQCF price Bread HQCF price Plywood/packagin HQCF price Rural
SLIDE 7
Assumptions Cassava yield: 15 t/ha Cost of labour: US$4 per day
‐200 ‐100 100 200 300 400 500 600 700 800 900 Oct 2010 Mar‐11 Jun‐11 Sep‐11 Dec‐11
US$/T HQCF
Costs of HQCF (flash dried) and projected market prices
capital costs Other factory costs Diesel WMP's net margin Wet mash processing Farmer's net margin Cost of FCR HQCF price Bread/Biscuit HQCF price Plywood/packaging HQCF price Rural HQCF price Other wheat flour
SLIDE 8
200 400 600 800 1000 1200 1400 Oct 2010 Mar 2011 Jun 2011 Sep 2011 Dec 2011 price (USD/t)
wheat flour (USD/t)
Uganda Tanzani a Malawi 200 400 600 800 1000 1200 1400 Oct 2010 Mar 2011 Jun 2011 Sep 2011 Dec 2011 price (USD/t)
HQCF (USD/t)
Uganda Tanzani a Malawi 20 40 60 80 100 120 140 Oct 2010 Mar 2011 Jun 2011 Sep 2011 Dec 2011 price (USD/t)
HQCF (USD/t)
Uganda Tanzani a Malawi
SLIDE 9
TARGET MARCH 2012 Uganda Tanzania Malawi Ghana Nigeria Direct beneficiaries (HQCF) 832 1319 188 4,768 27,564 HQCF produced 792 69 112 2,175 10,000 Benefit per beneficiary $113 $111 $131 $115 $139 ACHIEVED MARCH 2012 Uganda Tanzania Malawi Ghana Nigeria farmers 3188 1152 978 12908 farmer processors 2463 437 327 909 HQCF produced 805 177.8 123.7 2149 t FCR/farmer 1.01 0.62 0.51
0.67
t HQCF / processor 0.33 0.41 0.38
2.36
min profit farmers (USD/farmer/year) 21 5 13
1
max profit farmers (USD/farmer/year) 116 14 23
3
min profit processors (USD/processor/year) ‐11 ‐15 58
‐2
max profit processors (USD/processor/year) 73 23 71
5
SLIDE 10
TARGET MARCH 2012 Uganda Tanzania Malawi Ghana Nigeria Direct beneficiaries (HQCF) 832 1319 188 4,768 27,564 HQCF produced 792 69 112 2,175 10,000 Benefit per beneficiary $113 $111 $131 $115 $139 ACHIEVED MARCH 2012 Uganda Tanzania Malawi Ghana Nigeria farmers 3188 1152 978 12908 farmer processors 2463 437 327 909 HQCF produced 805 177.8 123.7 2149 t FCR/farmer 1.01 0.62 0.51
0.67
t HQCF / processor 0.33 0.41 0.38
2.36
min benefit farmers (USD/farmer/year) 36 18 19
21
max benefit farmers (USD/farmer/year) 123 30 28
30
min benefit processors (USD/processor/year) ‐1 29 77
135
max benefit processors (USD/processor/year) 82 68 90
165