SLIDE 1 Cosmic Rays WS 2018/19, TUM PD Dr. B. Majorovits 1
Cosmic rays
- 2. Observation of Ultra-high energy (UHE) cosmic rays and gamma
astronomy
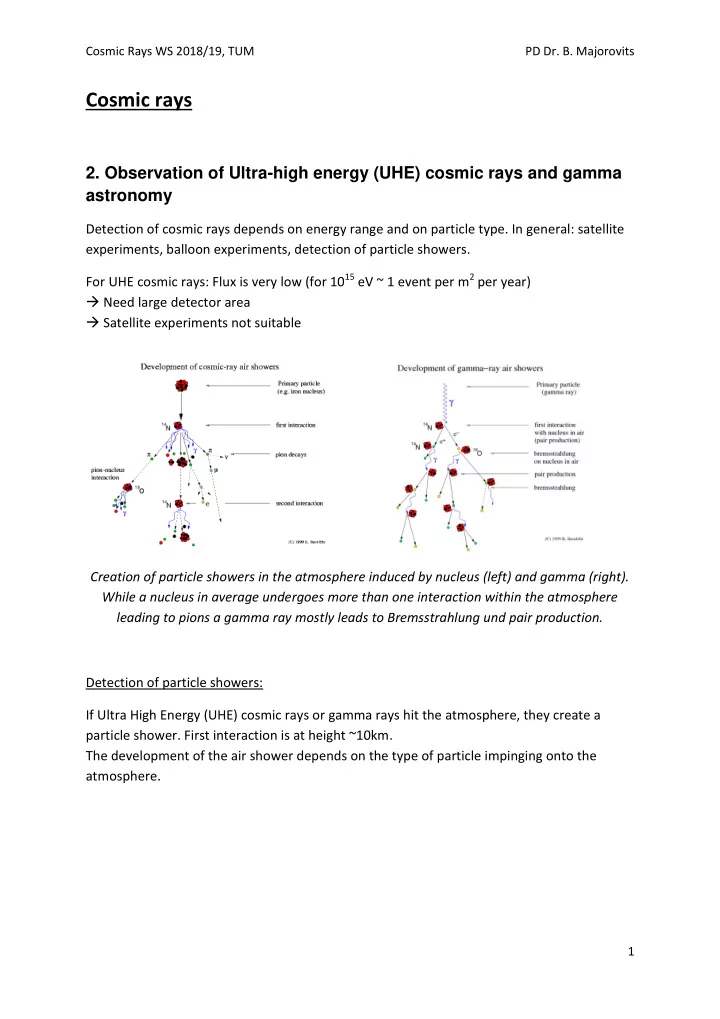
Detection of cosmic rays depends on energy range and on particle type. In general: satellite experiments, balloon experiments, detection of particle showers. For UHE cosmic rays: Flux is very low (for 1015 eV ~ 1 event per m2 per year) Need large detector area Satellite experiments not suitable Creation of particle showers in the atmosphere induced by nucleus (left) and gamma (right). While a nucleus in average undergoes more than one interaction within the atmosphere leading to pions a gamma ray mostly leads to Bremsstrahlung und pair production. Detection of particle showers: If Ultra High Energy (UHE) cosmic rays or gamma rays hit the atmosphere, they create a particle shower. First interaction is at height ~10km. The development of the air shower depends on the type of particle impinging onto the atmosphere.
SLIDE 2 Cosmic Rays WS 2018/19, TUM PD Dr. B. Majorovits 2
The particles in an air shower (left) are much more widely distributed for proton than for gamma-ray showers. This is reflected in the distribution of photons in the detector (right).
- Figs. Taken from [http://www.gae.ucm.es/~emma/docs/tesina/node17.html].
Highest energetic particles are detected by: secondary particles on earth surface: muons, pinons, protons…. fluorescence light created by excited nitrogen in atmosphere can be used. Radio emission due to net drift of charged particles in shower due to interaction with geomagnetic field Displacement of positive and engative charges Change of particle density EM pulse!
SLIDE 3 Cosmic Rays WS 2018/19, TUM PD Dr. B. Majorovits 3
The Pierre Auger Observatory: 1600 surface water Čerenkov detectors on surface of ~3000 km2 located in Argentina. Water Čerenkov detectors consist of 12 ton ultra clean water tanks viewed by three PMTs from the top. Additionally four fluorescence telescopes view the active volume/area. Pierre Auger upgrade 2019/2020: Radio measurements at 30-80MHz! Complementary to scintillators at high zenith angles Telescope Array (Utah, USA) follows very similar concept (3 FDs, 507 SDs). Left: map of the Pierre Auger observatory. Each black dot corresponds to one surface detector (SD). Four fluorescence detectors at the edge if the observatory view the area
- above. Center: Drawing of a SD. Right Picture af an SD.
SLIDE 4
Cosmic Rays WS 2018/19, TUM PD Dr. B. Majorovits 4
Left: energy spectra derived from surface detectors and hybrid data recorded at the Pierre Auger Observatory. The error bars represent statistical uncertainties. The upper limits correspond to the 84% C.L. Center: fractional difference between the Auger spectra and a reference spectrum with an index of 3.26. Taken from [arXiv: 1509.03732]. Right: Spectrum recorded with the Telescope array Taken from [Astropart. Phys. 48 (2013)16] Observation of cosmic rays with energies up to 1020.2 eV. A cutoff is clearly visible in the spectrum at ~1020eV Observation of GZK cutoff? Observation of energy cutoff for acceleration mechanism? Non-conclusive: mixture of both? Composition of UHE cosmic ray: The depth at which the shower reaches its maximum 𝑌𝑛𝑏𝑦 is different for nuclei with different mass. Obtaining 𝑌𝑛𝑏𝑦 distributions for different energies from measurement of fluorescent detectors, information can be obtained about the effective mass of the cosmic ray nuclei. The mean (left,right) and the standard deviation (center) of the measured 𝑌𝑛𝑏𝑦 distributions For Piearra Auger (left) as a function of energy compared to air-shower simulations for proton and iron primaries. Taken from [The Pierre Auger Observatory: Contributions to the 34th International Cosmic Ray Conference (ICRC 2015), arXiv: 1509.03732/1511.02103].Energy spectrum compared to best-fit parameters (right) for a specific propagation model along with data point from PA (taken from [arxiv:1612.08188])
SLIDE 5
Cosmic Rays WS 2018/19, TUM PD Dr. B. Majorovits 5
At highest energies: Composition of cosmic rays tends towards heavier elements! Hint towards upper energy for acceleration mechanism? Higher mass nuclei exceed GZK limit for protons, i.e. no contradiction! Angular distribution of UHE events: Charged particles are deflected by intergalactic magnetic fields Expect isotropic distribution for cosmic rays with 𝐹<1019eV For 𝐹~1020eV: Expect distribution information roughly maintained if within ~ Mpc (some Star Burst Galaxies and AGNs). correlation of E > 5.3 ∙ 1019𝑓𝑊 (Larmor radius 𝑠(55𝐹𝑓𝑊, 10𝜈𝐻)~5 𝑁𝑞𝑑) events with location of Active Galactic Nuclei? PA observatory observes large scale anisotropy above 8·1018 eV at 5.6 σ! Distribution seems to follow large scale structure fluctuations
Observation of correlation with Star Burst galaxies(SBG) & AGNs:
Test: Calculate how much better model containing anisotropic source explains observations than completely isotropic model Used map of known sources (AGNs + SBGs)+ model for propagation to predict UHECR source distribution. Test different models against isotropic distribution 4.0σ for correlation with SBGs! 2.7σ for correlation with γAGNs Caution in interpretation: propagation model has uncertainties due to propagation effects!
SLIDE 6
Cosmic Rays WS 2018/19, TUM PD Dr. B. Majorovits 6
: Observed excess map (left) and modelled excess map for UHECR with E>39MeV. Note that the area within the dashed line is outside of the field of view of the PA observatory! Gamma Ray Astronomy: Wherever high energetic processes are leading to acceleration of charged particles to extreme energies: Expect gamma rays from synchrotron radiation, inverse Compton Effect and via 𝜌0 production! Difficult to disentangle between proton driven and inverse Compton Scattering spectra! Possible production mechanisms for high energy gamma rays. Left: Proton acceleration can lead to pion production. Gammas emitted during the decay of 𝜌0are boosted. Center: A high energetic electron in a magnetic field can lead to synchrotron radiation or undergo inverse Compton scattering. Right: Expected shape of energy spectra for the three production mechanisms. Gammas keep directional information Identification of sources possible. Possible sources: Supernova remnants (Crab nebula), Binaries: White dwarf, red giant (V407 Cygni) , Pulsars (PSR J0101-6422), AGNs (Centaurus A), Blazars (PKS 0537-286)
SLIDE 7 Cosmic Rays WS 2018/19, TUM PD Dr. B. Majorovits 7
Locations of 2704 gamma-ray bursts detected by the BATSE instrument during nine years of
- bservations. Statistical tests confirm that the bursts are isotropically distributed on the sky -
no significant quadrupole moment or dipole moment is found. Taken from [heasarc.gsfc.nasa.gov] Gamma Ray Bursts: First observed in the 1960s by satellite mission designed to detect pulses from nuclear power tests. Non terrestrial, i.e. cosmic origin of GRBs was concluded in 1973. BATSE satellite measured direction of bursts isotropic distribution not galactic
SLIDE 8 Cosmic Rays WS 2018/19, TUM PD Dr. B. Majorovits 8
A 360◦ vista showing the entire sky, with visible structures stretching back in distance, time, and redshift. The most distant light we observe comes from the radiation leftover from the Big Bang: the CMB. As we descend the chart, we find the most distant objects known, followed by a web of Sloan Digital Sky Survey (SDSS) quasars and galaxies. Closer to home, we start to see a collection of familiar “near” galaxies ( purple triangles). Also marked are all Swift GRBs with known distances (blue stars); SN 1997ff, the most distant type Ia supernova at z = 1.7; and the archetypal large galaxy cluster, the Coma cluster. The redshift distances of most distant GRBs are comparable to the most distant galaxies and quasars. Taken from [Annu. Rev. Astron. Astrophys. 47(2009.)567]. Beppo SAX satellite (1996-2002) could measure afterglows in very distant faint galaxies cosmological distances extremely powerful phenomena Energy release in terms of gamma photons ~ 1043−47𝐾 (up to 1059photons per second during peak)! Swift satellite: high-quality observations of hundreds of bursts, and facilitating a wide range
- f follow-up observations within seconds of each event.
Origin as of yet unclear: Probably shock front from merger of super dense objects: neutron stars, black holes…, jets from type SNII, Progenitor: massive Wolf-Rayet stars? Observation of astrophysical gamma rays: Atmosphere prohibits direct detection of gammas: Absorption in atmosphere! Two possibilities: Balloons, satellites Ground based: observation of showers Transparency of earth atmosphere of radiation as function of frequency. The blue line represents the height at which 50% of the radiation of the given frequency is absorbed by the
- atmosphere. The atmosphere is transparent to visible light and radio frequencies, but not to
gamma rays.
SLIDE 9 Cosmic Rays WS 2018/19, TUM PD Dr. B. Majorovits 9
Satellite experiment: FERMI International mission to perform gamma-tray astronomy with additional x-ray monitor for Gamma Ray Bursts (GRBs). FERMI was launched June 2008 and is taking data since Aug.
- 2008. Strategy: Survey 20% of sky at any time, entire sky every three hours (2 orbits)
FERMI-LAT (Large Area Telescope): Left: The Fermi spacecraft shortly before launch. The solar panels are folded at the sides. The GBM detector modules and the telemetry antennas can be seen on the left side. Right: The 18 tungsten converter layers and 16 dual silicon tracker planes are stacked in 16 modular "towers" (37 cm square and 66 cm tall). Each of the 16 calorimeter modules consists of 96 long, narrow CsI scintillators, stacked in 8 layers, alternating in orientation so that the location and spread of the deposited energy can be determined. The plastic anticoincidence scintillator around the outside is made of 89 individual sections so that it can distinguish charged particles coming from the direction of the incident gamma ray and ignore others. Figs from [https://www-glast.stanford.edu] Anti-coincidence detector: Detect background Tracker: Direction Calorimeter: Energy
SLIDE 10 Cosmic Rays WS 2018/19, TUM PD Dr. B. Majorovits 10
Sky map of γ -ray counts above 10 GeV in Galactic coordinates. The Galactic center is at the center of the map. The color code displays the flux of gamma rays aboe 10GeV per solid
- angle. Taken from [The Astrophys. J. Supp. Series, 209(2013)34.
Extensive catalogue of Gamma sources (2013) 514 sources of E>10GeV, 449 associated with known sources 393 AGNs 27 Pulsars, 20(12) with significant pulsation above 10(25) GeV Air Čerenkov Gamma Telescopes: Cherenkov light of an air-shower illuminates area of ~105 m² on the ground with ~10-1000 ph./m² depending on the energy. A large reflector placed on the ground can catch the Cherenkov light and focuse it on a highly sensitive, fast integrated camera. Whereas with a single telescope the incoming particle direction is degenerate, the use of several telescopes to detect the same events will prevent this as well as improve efficiently the reconstruction of several parameters of the shower (like the angular resolution), and the background rejection. Fig. from [http://isdc.unige.ch/cta/]
SLIDE 11 Cosmic Rays WS 2018/19, TUM PD Dr. B. Majorovits 11
(Imaging Air shower Cherenkov Telescopes) The light can be collected by large mirror telescopes an imaged on a very fast and sensitive camera. The images can be used to reconstruct the energy, direction and type of primary particle. HESS, MAGIC and VERITAS have lead to boost in detection of extragalactic TeV sources. Many sources within galactic disc (HESS) detected Left: H.E.S.S. Galactic Plane Survey, with source identifiers indicated. Fig from [https://www.mpi-hd.mpg.de/hfm/HESS/pages/home/som/2012/09/]. Right: Number of detected TeV sources. Main observations: SN remnants:
- Detection of pulsed TeV emission of crab nebula
Cannot be from synchrotron radiation, as radius would be too large! Inverse Compton Scattering! Pulse profile of the Crab pulsar between 100 and 400GeV (upper panel) and above 400 GeV (bottom panel). The pulse profile, shown twice for clarity, is background subtracted. The bin width around the two peaks is 4 times smaller (0.007) than the rest (0.027) in order to
SLIDE 12 Cosmic Rays WS 2018/19, TUM PD Dr. B. Majorovits 12
highlight the sharpness of the peaks. Yellow-dashed areas identify the phase intervals of the two peaks, whereas the gray areas show the offpulse region. Taken from [A&A, 585 (2016) A133]
- Energie spectrum with gammas up to 30 TeV (3*1016eV)
No satisfactory model yet that can explain all observations (spectral shape,…) Combined FERMI-MAGIC measurement of Crab pulsar MAGIC Fermi measurement of Crab pulsar: Inverse Compton effect Blazars: Active Galactic Nuclei (AGN) with Jets pointed towards us: Model: Influx of matter onto central massive black hole. Flux variation very fast: MAGIC observation of IC310: 𝑢𝑤𝑏𝑠~10 𝑛𝑗𝑜 Small volume of source: 𝑆𝑤𝑏𝑠 = 𝑑 ∙ 𝑢𝑤𝑏𝑠~2 ∙ 1011 𝑛 Left: High-energy gamma rays flux variation of IC 310 observed with the MAGIC telescopes in the night of November 12th to 13th, 2012. The emission doubled on the timescales of 5 min, much shorter than the size of the black hole (estimated to be 20min after taking into account shorter time variability of the jet due to relativistic effect), indicating that the gamma ray emissions occur in much smaller regions than the black hole. (Credit: The MAGIC Collaboration) Compare to Schwarzschild radius of object with 2 ∙ 108𝑁⊙:
SLIDE 13 Cosmic Rays WS 2018/19, TUM PD Dr. B. Majorovits 13
𝑆𝑡 = 2𝑁𝐻 𝑑2 ~1.5 ∙ 1011𝑛 Acceleration very close to the BH? Search for correlation with arrival directions from Ice Cube Neutrino telescope: Birth of neutrino multi-messenger astronomy: 22.Sept 2017: Observation of 290 TeV (2.9*1014eV) Neutrino coincident in source position and time with flaring γ-ray blazar: FERMI LAT, MAGIC, … many thousand authors!
Sky position of IceCube-170922A in J2000 equatorial coordinates overlaying the g-ray counts from Fermi-LAT above 1 GeV (A) and the signal significance as observed by MAGIC (B) in this region.
Observation with ICECUBE was complemented by very high energy γ-ray observation with MAGIC on 28th of Sept. Blazars very promising candidate for acceleration to required energies!
SLIDE 14
Cosmic Rays WS 2018/19, TUM PD Dr. B. Majorovits 14
Supernova explosions: Supernovae of type II are triggered by gravitational collapse at the end of fusion process (no fuel available). Gravitational energy is transformed into an explosion. Only stars with mass to bring up sufficient gravitational energy can trigger a SN explosion: 𝑁𝐷~8 𝑁⊙. Process leading to SN explosion for star with 𝑁~20 𝑁⊙: Once hydrogen in the stellar core is depleted and is dominated by Helium: gravitational pressure will be higher than radiation power. Star contracts, Temperature increases, H-shell is pushed outward (can still undergo fusion in spherical shell) Fusion from helium to carbon and oxygen starts Once helium is depleted fusion rate reduces, gravitational pressure exceeds radiation pressure, temperature increases Fusion from carbon and oxygen to neon, manganese, silicon and sulphur starts In the last step Silicon is fused to iron Onion shell structure: Durations of different burning cycles vary greatly: Hydrogen Helium Carbon Oxygen Neon Silicon 106 5 ∙ 105 600 0.5 1 0.004 For less massive stars evolution is similar, but constrained by the gravitational pressure and, hence, by the core temperature. If temperature is not high enough, next burning cycle cannot be ignited In core collapse SN: Once silicon is depleted: No further thermonuclear reactions No more radiation pressure to counteract gravitational pressure
SLIDE 15 Cosmic Rays WS 2018/19, TUM PD Dr. B. Majorovits 15
Gravitational collapse Core mass exceeds Chandrasekhar mass limit 𝑁𝐷ℎ𝑏~1.4𝑁⊙ Core becomes instable and implodes Electrons are captured by protons: 𝑞 + 𝑓− → 𝑜 + 𝜉𝑓 Emission of ~1057neutrinos within ~0.1𝑡 ! Transport of ~1057 ∙ 10 𝑁𝑓𝑊 = 1058𝑁𝑓𝑊 in form of neutrinos away from core Compression of core to density 𝜍~2.5 ∙ 1014 𝑑𝑛−3 and temperature 𝑈~1011𝐿 Collision of outer core onto central dense region Rebound shock wave with speed 𝑤~1
3𝑑
Rebound shock wave and neutrinos collide with outer shells of star and ignite explosion Core density Core radius: Core before implosion: 𝜍𝑗~1011 𝑑𝑛−3 ~103𝑙𝑛 Before reaching 𝑁𝐷ℎ𝑏 ~102𝑙𝑛 After collapse: 𝜍𝑗𝑗~2.5 ∙ 1014 𝑑𝑛−3 ~20 𝑙𝑛