
8-8-2013 1
Options for NEA Mackerel Plan
John Simmonds FRS Aberdeen
Contents of presentation
- Strategies to be evaluated (2 slides)
- NEA Mackerel Average Catch / average
SSB with perfect knowlege(1 slide)
- Basic approach to this review(1 slide)
- Results (7 quick slides)
- Tradeoffs (5 slides)
- Strategies that have been evaluated
– EU Commissions Fishing Mortality rule – HR rule – Constant TAC rule – All rules include a reduction in catch below some trigger point in SSB – All rules contain a limit to change in TAC, either always or only above the trigger SSB – Options are to give
SSB F
[A] [C]
SSB TAC SSB TAC
Fishing Mortality or Harvest Rule TAC Each Harvest Control Rule (HCR) has one set of values for A,B&C A Target Rate B % change in TAC (always or only above C) C Trigger Biomass Strategies tested:- Commission’s target F rule based on Fishing Mortality Target Harvest rule based of fraction of Spawning Stock Biomass (SSB) Fixed TAC rule TAC Rule TAC % only above C % Always
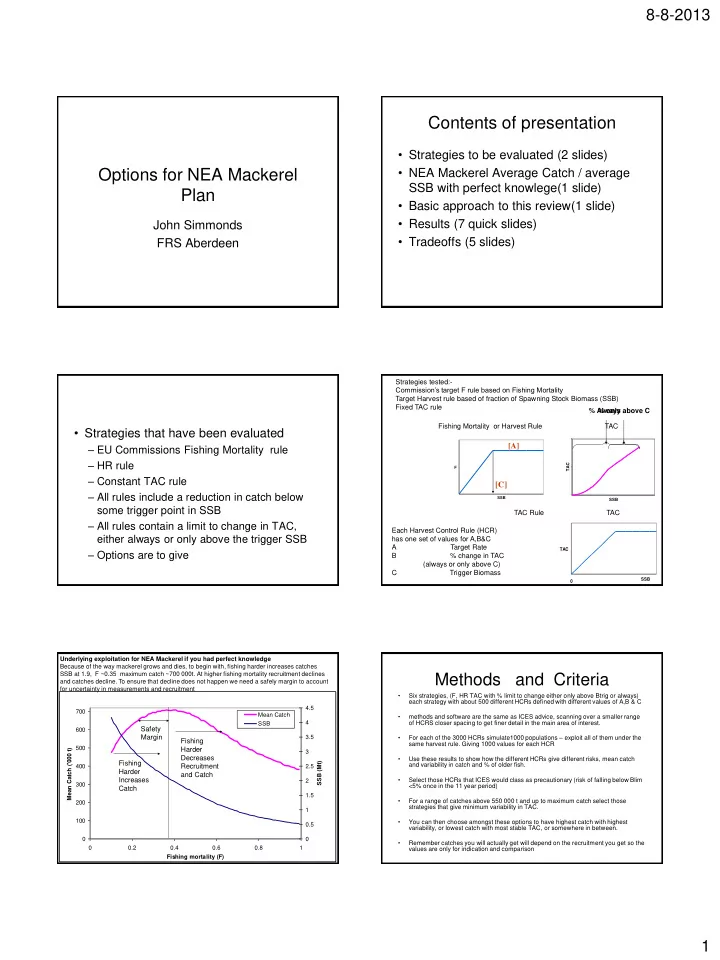
100 200 300 400 500 600 700 0.2 0.4 0.6 0.8 1 Fishing mortality (F) Mean Catch ('000 t) 0.5 1 1.5 2 2.5 3 3.5 4 4.5 SSB (Mt) Mean Catch SSB
Fishing Harder Increases Catch
Underlying exploitation for NEA Mackerel if you had perfect knowledge Because of the way mackerel grows and dies, to begin with, fishing harder increases catches SSB at 1.9, F ~0.35 maximum catch ~700 000t. At higher fishing mortality recruitment declines and catches decline. To ensure that decline does not happen we need a safely margin to account for uncertainty in measurements and recruitment
Safety Margin Fishing Harder Decreases Recruitment and Catch
Methods and Criteria
- Six strategies, (F, HR TAC with % limit to change either only above Btrig or always)
each strategy with about 500 different HCRs defined with different values of A,B & C
- methods and software are the same as ICES advice, scanning over a smaller range
- f HCRS closer spacing to get finer detail in the main area of interest.
- For each of the 3000 HCRs simulate1000 populations – exploit all of them under the
same harvest rule. Giving 1000 values for each HCR
- Use these results to show how the different HCRs give different risks, mean catch
and variability in catch and % of older fish.
- Select those HCRs that ICES would class as precautionary (risk of falling below Blim
<5% once in the 11 year period)
- For a range of catches above 550 000 t and up to maximum catch select those
strategies that give minimum variability in TAC.
- You can then choose amongst these options to have highest catch with highest
variability, or lowest catch with most stable TAC, or somewhere in between.
- Remember catches you will actually get will depend on the recruitment you get so the
values are only for indication and comparison