
SLIDE 1
Interests Maintain lake levels efficiently to preserve life - - PowerPoint PPT Presentation
Interests Maintain lake levels efficiently to preserve life throughout the entire Colorado Basin Ensure the health and safety of all residents: Water availability, quality and navigability Maintain economic stability of the Highland
Maintain lake levels efficiently to preserve life
Ensure the health and safety of all residents: Water
Maintain economic stability of the Highland Lakes
The City of Austin has major economic interests at
Low lake levels/Stored Water conditions
Lack of rainfall Pre-existing, un-amended water rights/contracts WMP allows interruptible customers water use to continue
down to 325,000 ac-ft. (January 1) or 200,000 ac-ft. otherwise
Adapt for changing population “Water available to sell” No incentives for “Firm” water customers to conserve water.
The conserved water may not stay in the lakes.
Firm customers bear the risk Water runoff downstream in flood periods is not stored “Interruptible” customers have not been treated as such
Year City of Austin Total Area Population City of Austin Full Purpose Population City of Austin Limited Purpose Population Travis County Five County MSA (1) Simple Growth Rate
1950 132,459 160,980 256,645 1980 345,890 419,573 585,051 128 % 1990 465,622 576,407 846,227 45 % 2000 656,562 639,185 17,377 812,280 1,249,763 48 % 2010 790,390 777,953 12,437 1,024,266 1,716,289 37 % 2020 949,241 936,682 12,559 1,343,456 2,306,508 34 %
Source: Ryan Robinson, City Demographer, Department of Planning, City of Austin. March 2011.
NOTES: 1) The Five County Austin-Round Rock MSA wholly includes these counties: Bastrop, Caldwell, Hays, Travis and Williamson. 2) Population figures are as of April 1 of each year. 3) Historical and current period population figures for the City of Austin take into annexations that have
4) Forecasted population figures for the City of Austin do not assume any future annexation activity.
Counties 2008 2009 Travis $3,827,700,000 $3,392,500,000 Williamson $429,000,000 $385,000,000 Bastrop $119,900,000 $117,800,000 Llano $85,300,000 $86,900,000 Burnet $74,900,000 $60,700,000 Colorado $58,300,000 $44,500,000 Matagorda $48,300,000 $49,300,000 Fayette $38,300,000 $32,900,000 Wharton $36,600,000 $28,900,000 San Saba $4,020,000 $3,610,000
TOTALS
Source: State of Texas, Governor's office of Economic Development and Tourism
$4,722,320,000 $4,202,110,000
2009-2010 Chapter 41 “Robin Hood” Payments
Bastrop Bastrop, Elgin, Smithville, McDade Subtotal $0 Burnet Burnet $1,652,105,860 $0 Marble Falls $2,817,563,871 $3,076,289 Subtotal $3,076,289
County ISD Property Tax Base School District Payment
Colorado Columbus, Rice, Weimar Subtotal $29,934 Fayette Flatonia, LaGrange, Schulenburg, Fayetteville Subtotal $82,720 Source: Texas Education Agency
Matagorda BayCity, Tidehaven, Matagorda, Palacios, Van Vleck Subtotal $9,025,293
County ISD Property Tax Base School District Payment
San Saba San Saba, Richland Springs, Cherokee $0 Subtotal $0
Llano
not available Travis Lake Travis $7,055,548,113 $33,393,481 Austin $61,899,156,368 $132,271,140 Lago Vista $1,472,491,727 $6,037,313 Eanes $9,619,167,914 $58,512,006 Del Valle $0 Manor $0 Pflugerville $0 Subtotal $230,213,940 Source: Texas Education Agency
Wharton Boling, East Bernard, El Campo, Wharton, Louise $0 Subtotal $0
County ISD Property Tax Base School District Payment
Williamson Leander, Georgetown Subtotal $221,899
Upper Basin contribution is approximately 72% of total.
Source: Texas Education Agency
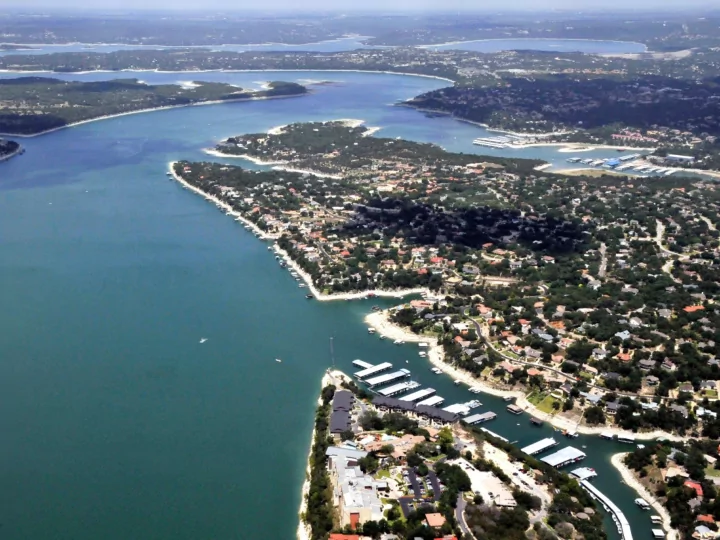
Assessed Market Values for Lake Travis Waterfront in Travis County*
Main Body $MM Coves $MM Associated Subdivisions $MM Total Waterfront Related $MM Increase %
1996 $309.5 $66.1 $614.7 $990.3 2002 $878.6 $196.6 $1,271.9 $2,347.1 + 137% vs 1996 2010 $2,044.0 $384.4 $1,924.8 $4,353.2 + 85% vs 2002
subdivisions now exceed $4.3Billion on Lake Travis in Travis County
can significantly impact premium lake values
* Data provided by Travis County Appraisal District
Burnet County Development of Waterfront Property & Associated Subdivisions Has Also Dramatically Increased since 2002
Waterfro nt $MM Associated Subdivisio ns $MM Waterfront $MM Associated Subdivision s $MM Waterfront Increase vs 2002, % Lake Travis
$97.5 $96.3 $45.3 $47.2 115%
Lake Buchanan
$218.6 $59.5 $114.7 $34.5 91%
Inks Lake Lake Marble Falls
$44.1 $84.0 $18.0 $38.7 145% 117%
Lake LBJ
$815.7 $297.4 174%
Other waterfront
$180.4 $35.1 414%
Total Waterfront
$1,440.2 $549.2 162%
Total Burnet Co
$6,529.5 $3,058.4 113%
* Data provided by Burnet County Appraisal District
2010 Market Values 2002 Market Values Assessed Market Values for Waterfront Properties in Burnet County*
2009 Study of Lake Travis
Sales ($MM) Jobs Labor Income ($MM) Value Added ($MM)
Marina Services $14.0 218.1 $5.2 $8.7 Repairs & Maintenance $12.0 75.3 $2.5 $5.6 Restaurant $11.8 274.2 $4.9 $5.6 Other Retail Trade $8.9 184.4 $4.2 $5.7 Fuel $6.0 62.9 $2.5 $3.3 All Other $7.2 104.0 $3.0 $5.2
Total Direct Effects $59.8 918.9 $22.2 $34.0 Secondary Effects $37.0 363.5 $12.8 $21.5 TOTAL EFFECTS
Source: Online Boating Economic Impact Tool, by Recreational Marine Research Center
$96.7 1,282.4 $35.0 $55.5
– Raise trigger point for complete curtailment of interruptible
and environmental releases
– If 2nd crop is curtailed, allow for lake level recovery before it is
re-instated
pool, plus estimated evaporation during drought of record (approx 430,000—600,000AF) –WAM 23 or WAM 11
to the entire basin
Using the lower of the “recreational” levels of Travis and
Buchanan
660 for Travis 1012 for Buchanan
Curtailment of irrigation should be started at 10% over this
level
These levels yield storage of 1.639 MAF At this level economic impact is affected
Boat ramps are closing Marinas are moving Tax base revenue affected
This would be fair to the entire basin
.9 MAF would be ~45% of capacity
Firm customers are affected already
Water intakes must be moved Water quality suffers Some municipalities have a hard time with access
Marinas are moved out of their moorings Resorts suffer Restaurants are closed Severe financial impact to lakes area businesses Severe financial impact to State—e.g. sales tax, Robin Hood
Firm reserves get perilously risky Interruptible should be curtailed before Firm
customers are cut back
All interests working together for the common good Raise awareness and sense of urgency in the public and government of
looming critical water issues
Water conservation should be consistent and mandatory with stronger
enforcement for agricultural, commercial and residential consumers
Conserved water to stay in lakes and/or supplement critical flows to
bays/estuaries.
New Water Contracts should be negotiated with new sources of water New off channel water reservoirs should be built –start immediately! Desalination of brackish water used for new power and industrial
plant.
Water supply plan should have same stakeholder committee as WMP
to eliminate “education” time
LCRA planning committees should have collaborative meetings or
Water reuse projects need increased focus and budgeting Lake intake pumping by private property owners needs to be
calculated and charged a market rate
Central Pivot and other agricultural irrigation should be
explored
Agricultural interest should get credit for environmental releases
when fields are drained
Convert more acreage to rice seed crop, row crops Downstream agricultural interests need plan for curtailment of
interruptible supplies
Trigger point times need to be set at shorter intervals and/or at
multiple lake levels –minimum 2 crop triggers
Recovery times for lake recharges should be established in the
planning methodology