SLIDE 1
i
SLIDE 2 Contents Contents
Tables i i Figures v v 1.0 1.0 Introduction 1 1 2.0 2.0 Me Methodology thodology 3 3 3.0 3.0 Knowsley 5 5 3.1 3.1 Drug Drug Te Testing sting Data Data 5 5 3.2 3.2 Assessments (DIR) 7 7 3.3 3.3 Care Plans 1 10 3.4 3.4 Tran Transfe sfers s from from Pri Prison
10 10 3.5 3.5 Kno Knowsle sley Summ Summar ary y 11 11 4.0 4.0 Liverpool 1 12 4.1 4.1 Drug Drug Te Testing sting Data Data 12 12 4.2 4.2 Assessments (DIR) 1 16 4.3 4.3 Care Plans 2 20 4.4 4.4 Tran Transfe sfers s from from Pri Prison
20 20 4.5 4.5 Li Liverpo verpool l Summ Summar ary y 21 21 5.0 5.0 Sefton 2 23 5.1 5.1 Drug Drug Te Testing sting Data Data 23 23 5.2 5.2 Assessments (DIR) 2 26 5.3 5.3 Care Plans 3 30 5.4 5.4 Tran Transfe sfers s from from Pri Prison
30 30 5.5 5.5 Sefton Summary 3 31 6.0 6.0 St Helens 3 33 6.1 6.1 Drug Drug Te Testing sting Data Data 33 33 6.2 6.2 Assessments (DIR) 3 36 6.3 6.3 Care Plans 4 40 6.4 6.4 Tran Transfe sfers s from from Pri Prison
40 40 6.5 6.5 St Helens Summary 4 41 7.0 7.0 Wirral 4 42 7.1 7.1 Drug Drug Te Testing sting Data Data 42 42 7.2 7.2 Assessments (DIR) 4 45 7.3 7.3 Care Plans 4 49 7.4 7.4 Tran Transfe sfers s from from Pri Prison
49 49
SLIDE 3 7.5 7.5 Wi Wirr rral al Summ Summar ary y 50 50 8.0 8.0 Me Merseyside rseyside Comp Compari arison
51 51 8.1 8.1 Drug Drug Te Testing sting Data Data 51 51 8.2 8.2 Assessments (DIRs) 5 52 8.3 8.3 Tran Transfe sfers s from from Pri Prison
52 52 9.0 9.0 Discussion 5 53 10.0 10.0 Conclusion 5 58 11.0 11.0 References 5 59
SLIDE 4 Centre for Public Health, Faculty of Health and Applied Social Sciences, Liverpool John Moores University, Castle House, North Street, Liverpool, L3 2AY Tel: 0151 231 4544
i
Tables Tables
Table K ble K1 – Freq – Frequen uency of re-pre cy of re-presentation o sentation of clients clients who h who had d a a su succe ccessful dru sful drug test completed 5 5 Table K ble K2 2 – Re-p – Re-pre resentation o sentation of clients b clients by ge gender nder 5 Table K ble K3 – Re-p – Re-pre resentation o sentation of clients b clients by e ethni hnicity city 6 Table K ble K4 4 – Re-p – Re-pre resentation o sentation of clients b clients by o
ffence e 6 Table K5 – Test Result 6 6 Table K ble K6 6 – Freq – Frequen uency of re-pre cy of re-presentation o sentation of clients clients who tested po who tested positi sitive ve 6 Table K ble K7 7 – Freq – Frequen uency of re-pre cy of re-presentation o sentation of clients clients who h who had d an an asse assessment sment completed 7 7 Table K ble K8 8 – Re-p – Re-pre resentation o sentation of clients b clients by ge gender nder 7 Table K ble K9 – Re-p – Re-pre resentation o sentation of clients b clients by e ethni hnicity city 8 Table K ble K10 10 – Re-pre – Re-presentation sentation of
clients by offen
e 8 Table K ble K11 11 – Drug u – Drug use in p e in past mo st month nth 8 Table ble K12 12 – – Life Lifetime time injecting injecting 9 9 Table ble K13 – 13 – Re-pre Re-presentation of clients sentation of clients by accommod accommodatio tion n 9 Table K ble K14 14 – Re-pre – Re-presentation sentation of
clients by emplo employmen ment 9 Table ble K15 – 15 – Fre Frequen quency cy of re-pre
sentation tation of clients who f clients who had a care d a care pl plan an completed 1 10 Table K ble K16 16 – Fre – Frequen quency of cy of re-pre re-presen sentation ation of clients who f clients who had su d succe ccessful sful tran transfer sfer completed 1 11 Table L1 ble L1 – Freq – Frequen uency of re-pre cy of re-presentation o sentation of clients clients who h who had d a a su succe ccessful dru sful drug g test completed 1 12 Table L2 ble L2 – Re-p – Re-pre resentation o sentation of clients b clients by ge gender nder 12 12 Table L3 ble L3 – Re-p – Re-pre resentation o sentation of clients b clients by e ethni hnicity city 13 13 Table L4 ble L4 – Re-p – Re-pre resentation o sentation of clients b clients by o
ffence e 14 14 Table ble L5 L5 – – Te Test st Re Result sult 14 14 Table L6 ble L6 – Freq – Frequen uency of re-pre cy of re-presentation o sentation of clients clients who tested po who tested positi sitive ve 15 15 Table L7 ble L7 – Freq – Frequen uency of re-pre cy of re-presentation o sentation of clients clients who h who had d an an asse assessment sment completed 1 16 Table L8 ble L8 – Re-p – Re-pre resentation o sentation of clients b clients by ge gender nder 16 16 Table L9 ble L9 – Re-p – Re-pre resentation o sentation of clients b clients by e ethni hnicity city 17 17 Table L1 ble L10 0 – Re-pre – Re-presentation sentation of
clients by offen
e 17 17 Table L1 ble L11 1 – Drug u – Drug use in p e in past mo st month nth 18 18
SLIDE 5 Centre for Public Health, Faculty of Health and Applied Social Sciences, Liverpool John Moores University, Castle House, North Street, Liverpool, L3 2AY Tel: 0151 231 4544
ii
Table ble L1 L12 2 – – Life Lifetime time injecting 18 injecting 18 Table ble L1 L13 – 3 – Re-pre Re-presentation of clients sentation of clients by accommod accommodatio tion n 18 18 Table L1 ble L14 4 – Re-pre – Re-presentation sentation of
clients by emplo employmen ment 19 19 Table L1 ble L15 5 – Fre – Frequen quency of cy of re-pre re-presen sentation o ation of clients clients who who h had d a a care pl care plan an completed 2 20 Table L1 ble L16 6 – Fre – Frequen quency of cy of re-pre re-presen sentation ation of clients who f clients who had su d succe ccessful sful tran transfer sfer completed 2 20 Table S ble S1 1 – Re-p – Re-pre resentation o sentation of clients clients who who had had a su a succe ccessful drug sful drug te test st completed completed 23 23 Table S ble S2 2 – Re-p – Re-pre resentation o sentation of clients b clients by ge gender nder 23 23 Table S ble S3 – Re-p – Re-pre resentation o sentation of clients b clients by e ethni hnicity city 24 24 Table S ble S4 4 – Re-p – Re-pre resentation o sentation of clients b clients by o
ffence e 24 24 Table ble S5 – – Te Test st Re Result sult 24 24 Table S ble S6 6 – Freq – Frequen uency of re-pre cy of re-presentation o sentation of clients clients who tested po who tested positi sitive ve 25 25 Table S ble S7 7 – Freq – Frequen uency of re-pre cy of re-presentation o sentation of clients clients who h who had d an an asse assessment sment completed 2 26 Table S ble S8 8 – Re-p – Re-pre resentation o sentation of clients b clients by ge gender nder 26 26 Table S ble S9 – Re-p – Re-pre resentation o sentation of clients b clients by e ethni hnicity city 27 27 Table S ble S10 10 – Re-pre – Re-presentation sentation of
clients by offen
e 27 27 Table S ble S11 11 – Drug u – Drug use in p e in past mo st month nth 28 28 Table ble S12 12 – – Life Lifetime time injecting injecting 28 28 Table ble S13 – 13 – Re-pre Re-presentation of clients sentation of clients by accommod accommodatio tion n 28 28 Table S ble S14 14 – Re-pre – Re-presentation sentation of
clients by emplo employmen ment 29 29 Table S ble S15 15 – Fre – Frequen quency of cy of re-pre re-presen sentation o tation of f clients clients who who h had d a a care pl care plan an completed 3 30 Table S ble S16 16 – Fre – Frequen quency of cy of re-pre re-presen sentation ation of clients who f clients who had su d succe ccessful sful tran transfer sfer completed 3 30 Table ble ST1 – T1 – Fre Frequen quency cy of re-pre
sentation tation of clients who f clients who had a su d a succe ccessful sful dru drug test completed 3 33 Table S ble ST2 T2 – Re-pre – Re-presentation sentation of
clients by gen gender der 33 33 Table S ble ST3 T3 – Re-pre – Re-presentation sentation of
clients by ethnicity ethnicity 34 34 Table S ble ST4 T4 – Re-pre – Re-presentation sentation of
clients by offen
e 34 34 Table ble ST5 T5 – – Te Test st Re Result sult 34 34 Table S ble ST6 T6 – Fre – Frequen quency of cy of re-pre re-presen sentation o ation of clients clients who who te tested sted po positi sitive ve 35 35 Table ble ST7 – T7 – Fre Frequen quency cy of re-pre
sentation ation of clients who clients who had an asse d an assessment sment completed 3 36
SLIDE 6 Centre for Public Health, Faculty of Health and Applied Social Sciences, Liverpool John Moores University, Castle House, North Street, Liverpool, L3 2AY Tel: 0151 231 4544
iii
Table S ble ST8 T8 – Re-pre – Re-presentation sentation of
clients by gen gender der 36 36 Table S ble ST9 T9 – Re-pre – Re-presentation sentation of
clients by ethnicity ethnicity 36 36 Table S ble ST10 – Re-pre T10 – Re-presentation sentation of
clients by offence
37 37 Table S ble ST11 – T11 – Drug u Drug use in p e in past st month month 38 38 Table ble ST12 T12 – – Life Lifetime time inje injecting cting 38 38 Table S ble ST13 – Re-pre T13 – Re-presentation sentation of
clients by accommo accommodation dation 3 39 Table S ble ST14 – Re-pre T14 – Re-presentation sentation of
clients by emplo employmen ment 39 39 Table S ble ST15 – Fre T15 – Frequen quency of re-presentatio cy of re-presentation of n of clients clients wh who h
d a a care care plan plan completed 4 40 Table S ble ST16 – Fre T16 – Frequen quency of re-presentatio cy of re-presentation of n of clients clients wh who h
d su succe ccessful transfer sful transfer completed 4 40 Table W1 – ble W1 – Re-pre Re-presentation of clients who sentation of clients who had a su d a succe ccessful sful dru drug te test st completed 4 42 Table W2 – ble W2 – Re-pre Re-presentation of clients sentation of clients by gen gender der 42 42 Table W3 – ble W3 – Re-pre Re-presentation of clients sentation of clients by ethnicity ethnicity 43 43 Table W4 – ble W4 – Re-pre Re-presentation of clients sentation of clients by offen
e 43 43 Table ble W5 W5 – – Te Test st Re Result sult 44 44 Table W6 – ble W6 – Fre Frequen quency cy of re-pre
sentation ation of clients who clients who te tested sted po positi sitive ve 44 44 Table W7 – ble W7 – Fre Frequen quency cy of re-pre
sentation ation of clients who clients who had an asse d an assessment sment completed 4 45 Table W8 – ble W8 – Re-pre Re-presentation of clients sentation of clients by gen gender der 45 45 Table W9 – ble W9 – Re-pre Re-presentation of clients sentation of clients by ethnicity ethnicity 46 46 Table W10 – Re-pre ble W10 – Re-presen sentation ation of clients clients by offence
46 46 Table ble W11 W11 – – Drug Drug use in in past st month
47 47 Table ble W12 W12 – – Life Lifetime time inje injecting cting 47 47 Table W13 – Re-pre ble W13 – Re-presen sentation ation of clients clients by accommo accommodation dation 47 47 Table W14 – Re-pre ble W14 – Re-presen sentation ation of clients clients by emplo employmen ment 48 48 Table W15 – ble W15 – Frequen Frequency cy of re-pre
sentation of clients who
d a care pl plan an completed 4 49 Table W16 – ble W16 – Frequen Frequency cy of re-pre
sentation of
clients who had su d succe ccessful sful tran transfer sfer completed 4 49 Table ble M1 – 1 – Re-pre Re-presentation of clients who sentation of clients who had a su d a succe ccessful sful dru drug g te test completed st completed -
Merseyside rseyside comp compari arison
51 51 Table ble M2 – 2 – Re-pre Re-presentation of clients who sentation of clients who tested tested po positi sitive ve -
Merseyside rseyside comp compari arison
51 51
SLIDE 7 Centre for Public Health, Faculty of Health and Applied Social Sciences, Liverpool John Moores University, Castle House, North Street, Liverpool, L3 2AY Tel: 0151 231 4544
iv
Table ble M3 – 3 – Re-pre Re-presentation of clients who sentation of clients who had an asse d an assessment co sment completed – mpleted – Me Merseyside rseyside comp compari arison
52 52 Table ble M4 – 4 – Re-pre Re-presentation of clients w sentation of clients who ho had a su d a successful sful tr tran ansf sfer complet er completed – ed – Me Merseyside rseyside comp compari arison
52 52
SLIDE 8
Centre for Public Health, Faculty of Health and Applied Social Sciences, Liverpool John Moores University, Castle House, North Street, Liverpool, L3 2AY Tel: 0151 231 4544
v
Figures Figures
Fig 1 Fig 1: Kno : Knowsle sley Su Succe ccessful sful Drug T Drug Tests ests – – Age (September 07 Age (September 07 – – De December cember 07) 07) 5 Fig 2 Fig 2: Kno Knowsle sley Asse Assessmen ssments – Age (April 07 s – Age (April 07 – De – December 07) cember 07) 7 Fig 3 Fig 3: Liverpool S : Liverpool Succe ccessful sful Drug Drug Te Tests sts – – Age (April 07 Age (April 07 – – De Decembe cember 07) 07) 13 13 Fig 4 Fig 4: Liverpool Liverpool Assessmen Assessments – Age (April 07 s – Age (April 07 – De – December 07) cember 07) 16 16 Fig 5 Fig 5: Sefton S : Sefton Succe uccessful sful Drug Te Drug Tests sts – – Age (April 07 Age (April 07 – De – Decembe cember 07) 07) 23 23 Fig 6 Fig 6: Sefton : Sefton Assessments Assessments – – Age (April 07 Age (April 07 – De – Decembe cember 07) 07) 26 26 Fig 7 Fig 7: St : St Helen Helens S Succe uccessful sful Drug T Drug Tests ests – – Age (September 07 Age (September 07 – – De December cember 07) 07) 33 33 Fig 8 Fig 8: St St Helen Helens Asse Assessmen ssments – Age (April 07 s – Age (April 07 – De – December 07) cember 07) 36 36 Fig 9 Fig 9: Wirral Su : Wirral Succe ccessful Drug Te sful Drug Tests sts – Age (April 07 – Age (April 07 – – De December 07) cember 07) 43 43 Fig 10 Fig 10: Wirral Asse : Wirral Assessments ssments – – Age (April 07 Age (April 07 – – De Decembe cember 07) 07) 45 45
SLIDE 9 Centre for Public Health, Faculty of Health and Applied Social Sciences, Liverpool John Moores University, Castle House, North Street, Liverpool, L3 2AY Tel: 0151 231 4544
1
1.0 Introduction 1.0 Introduction
There is evidence to suggest that acquisitive crime is strongly associated with drug use (Seddon, 2000; Stewart et al, 2000). More specifically, research has suggested that heroin and crack use are linked to offending, with offenders stealing to fund their drug habit (Stewart et al, 2000). One of the main target groups for the Government is persistent drug users (Bennett and Holloway, 2004). The Drug Interventions Programme (DIP) was first introduced in 2003 to reduce crime and direct drug using offenders out of crime and into treatment. It has been suggested that DIP has subsequently had a considerable effect on achieving this, with a reduction in acquisitive crime seen in the UK since the introduction of DIP (Skodbo et al, 2007). Skodbo et al (2007) suggests that clients who enter DIP are likely to reduce their level of
- ffending. However, it is difficult to make this statement without a substantial control
group to compare with. Moreover, there is a lack of substantial research into the effects
- f DIP; therefore it is hard to suggest that the decrease in drug related crime is due to
- DIP. Nevertheless, evidence suggests that although offending may reduce, DIP clients
- ften re-enter the criminal justice system after their first arrest.
As part of the Drugs Act 2005 (Home Office, 2005), Test on Arrest replaced Test on Charge in an attempt to get more individuals into treatment quicker. Through Tough Choices individuals arrested for trigger offences such as theft, shoplifting and burglary are drug tested post arrest in an effort to direct drug using offenders out of crime and into treatment (Skodbo et al, 2007). Researchers have aimed to understand why clients re-offend and are subsequently
- reconvicted. Drug use is linked to offending rates, with 61% of prolific offenders at risk of
re-offending due to drug misuse (Dawson, 2005). Re-offending rates have been previously examined through the number of times offenders were re-convicted in court within two years. Cunliffe and Shepherd (2007) examined the re-offending rates across the UK between 2001 and 2004. Results from their study showed that there was a decrease in the proportion of re-offending between 2002 and 2004. Nevertheless, known re-offending rates were most common when the original offence was acquisitive, either theft or burglary (Cunliffe and Shepherd, 2007). Between 2000 and 2004, re-offending
SLIDE 10 Centre for Public Health, Faculty of Health and Applied Social Sciences, Liverpool John Moores University, Castle House, North Street, Liverpool, L3 2AY Tel: 0151 231 4544
2
figures decreased for younger clients (18-20 years old) from 69% to 64%, whereas it increased for older clients (aged 35 or over; 39% to 43%). The UK Drug Policy Commission (UKDPC; 2008) suggest that six months after contact with DIP, 48% of clients reduced their offending, whilst 28% of clients increased. DIP is attempting to reduce crime by directing clients into treatment, but once people are channelled into treatment it is the effectiveness of intervention that will determine whether they stay engaged and have positive outcomes. Beynon, Bellis and McVeigh (2006) found that there was a gradual increase in the numbers of clients who re- presented in treatment after dropping out between 1998 and 2001/02. Treatment
- utcomes did not appear to predict long term recovery with clients dropping out and
those being discharged drug free demonstrating similar levels of re-presentation to
- treatment. Therefore, completing a drug treatment programme does not necessarily
mean that clients will not reappear in drug treatment services. Moreover, Hser et al (1997) suggest that prior experience with successful treatment can actually predict that clients are more likely to re-enter treatment. As treatment outcome does not appear to predict re-entry, other characteristics must play a critical role. Aim Aims an and Obje d Objecti ctives The main aim of this report was to ascertain how many times individuals have re-entered the DIP process in Merseyside between April and December 07. The secondary aim was to examine the specific characteristics of drug using offenders that re-present in order to help D(A)ATs target their work on clients most in need and most likely to continue to be damaging to communities.
SLIDE 11 Centre for Public Health, Faculty of Health and Applied Social Sciences, Liverpool John Moores University, Castle House, North Street, Liverpool, L3 2AY Tel: 0151 231 4544
3
2.0 Methodology 2.0 Methodology
Drug Testing Data Drug testing data provided by Merseyside Police was used to compare characteristics of clients arrested and tested once against clients who were tested more than once between April and December 07 (Liverpool, Sefton and Wirral DIP) or September and December 07 (Knowsley and St Helens DIP). Test on Arrest was only introduced in September 07 in Knowsley and St Helens and as a result, four months of data was analysed for this report. For each D(A)AT area clients were split (via aggregation in SPSS) into a group who re- presented (more than one test during period) and a group who did not. The characteristics
- f clients at their first tests (or only test if they are from the non re-presenting group)
were compared, including demographic information, drug test results and offences
- committed. Drug testing data was also used to assess how many clients who had a
positive test result went on to have another positive test between April and December 07 for all Merseyside DIP areas. Drug Interventions Records (DIRs) Drug Interventions Records (DIRs) were used as a second data source to compare characteristics of assessed clients who re-presented and clients who did not between April and December 07. Clients entering DIP for the first time or re-entering the programme after a period of absence are assessed and a record of this assessment is taken on the DIR. The following analysis was performed by D(A)AT area of contact, rather than residence for all clients assessed by DIP staff in Knowsley, Liverpool, Sefton, St Helens and Wirral DIP. For each D(A)AT area, clients were split (via aggregation in SPSS) into a group who re-presented (more than one assessment during period) and a group who did not. The characteristics of clients at their first assessment (or only assessment if from the non re-presenting group) were compared including demographic information,
- ffences recorded, drug use and injecting behaviour, accommodation and employment
- status. Drug use and injecting behaviour were only analysed for clients who had used
drugs in the month prior to assessment. DIRs were also used to assess how many clients who had a care plan went on to have another care plan completed between April and December 07 for all Merseyside DIP areas.
SLIDE 12
Centre for Public Health, Faculty of Health and Applied Social Sciences, Liverpool John Moores University, Castle House, North Street, Liverpool, L3 2AY Tel: 0151 231 4544
4
Analysis was also performed to determine the number of clients who were transferred into the DIP teams from prison more than once during the period. Activity Forms were used to identify the total number of clients who had a successful transfer from prison completed who subsequently re-presented between April and December 07. Please note, for some analysis particularly for Knowsley, the numbers of clients discussed were very small and so conclusions should be drawn with caution. The following sections detail each of the five Merseyside D(A)AT consecutively. Proportions relating to client characteristics including ethnicity, accommodation and employment on the DIRs have been calculated by the number of responses, not the total number of clients. All other proportions have been calculated from the total number of clients unless stated. For all figures, percentages have been rounded to one decimal place and therefore occasionally figures will add up to more than 100%.
SLIDE 13 Centre for Public Health, Faculty of Health and Applied Social Sciences, Liverpool John Moores University, Castle House, North Street, Liverpool, L3 2AY Tel: 0151 231 4544
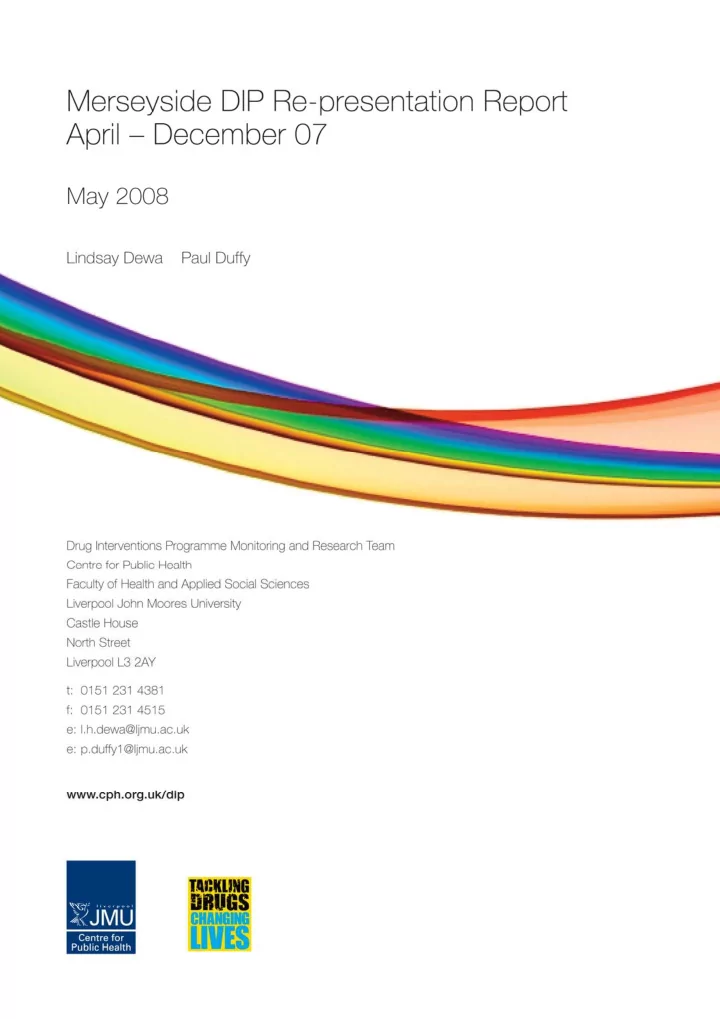
5 Fi Fig g 1: 1: K Know
sley S ey Succe ccessf sful D Drug T Test sts - s - Age (Sept eptem ember 07 07 - D Dece cember 07) 07)
38.9 3.8 18.8 25.0 0.0 18.8 0.0 8.4 13.3 16.3 13.0 6.3 31.3 6.3
5 10 15 20 25 30 35 40 45 under 25 25 - 29 30 - 34 35 - 39 40 - 44 45 - 49 50 and over
Age ge G Group
%
Did not re-present (n=368) Re-presented (n=16)
3.0 Knowsley 3.0 Knowsley
3.1 Drug Testing Data 3.1 Drug Testing Data
Table K ble K1 1 – F – Frequen equency o cy of re-p re-pre resentation of sentation of clients clients who h who had a a succe successful drug ssful drug te test st completed completed Re-pre Re-presentation sentation Fre Frequen quency cy (n=3 (n=384) 84) Nev Never r 368 (95.8%) 2 ti 2 times mes 14 (3.6%) 3 ti 3 times mes 1 (0.3%) 4 ti 4 times mes 1 (0.3%) The majority of clients (95.8%) did not re-present between September and December 07. Table K ble K2 2 – Re-p – Re-pre resentation o sentation of clients b clients by ge gender nder Di Did not d not re-pre re-present (n=368) sent (n=368) Re-pre Re-presented (n=16) sented (n=16) Fem Female ale 71 (19.3%) 1 (6.3%) Ma Male le 297 (80.7%) 15 (93.8%) Just under a fifth of clients who did not re-present were female (19.3%). Only one client who re-presented was female (6.3%). Generally clients who re-presented were older than those who did not. Just under a third (31.3%) of clients who re-presented were under 25 compared to those who did not re- present (38.9%). A quarter of all clients (25.0%) who re-presented between September and December 07 were between 30 and 34 years old.
SLIDE 14 Centre for Public Health, Faculty of Health and Applied Social Sciences, Liverpool John Moores University, Castle House, North Street, Liverpool, L3 2AY Tel: 0151 231 4544
6
Table K ble K3 – Re-p – Re-pre resentation o sentation of clients b clients by e ethni hnicity city Di Did not d not re-pre re-present (n=367)* sent (n=367)* Re-pre Re-presented (n=16) sented (n=16) Black Black 2 (0.5%) Whit White e 360 (98.1%) 16 (100.0%) Other Other 5 (1.4%)
*One client who did not re-present did not provide information regarding their ethnicity.
All clients who re-presented were white. Table K ble K4 4 – Re-p – Re-pre resentation o sentation of clients b clients by o
ffence e Offen Offences Di Did not d not re-pre re-present (n=368) sent (n=368) Re-pre Re-presented (n=16) sented (n=16) Burgla Burglary ry 35 (9.5%) 4 (25.0%) Fraud Fraud 24 (6.5%) 1 (6.3%) Going equipped Going equipped 6 (1.6%) Handling stolen Handling stolen go good
s 10 (2.7%) 1 (6.3%) MD MDA of
nces es 79 (21.5%) 1 (6.3%) Non-Trigge Non-Trigger Offen r Offences 24 (6.5%) 1 (6.3%) Robbery Robbery 13 (3.5%) The Theft ft 173 (47.0%) 7 (43.8%) Vehi Vehicle T cle Taking king 4 (1.1%) 1 (6.3%) The most common offence for both client groups was theft (47.0% did not re-present, 43.8% re-presented). A quarter of clients (25.0%) who re-presented committed burglary, a higher proportion than among those clients who did not re-present (9.5%). Table K ble K5 5 – Te – Test st Re Result sult Di Did not d not re-pre re-present (n=368) sent (n=368) Re-pre Re-presented (n=16) sented (n=16) Both ( th (Co Cocaine caine and and O Opiate iates) s) 36 (9.8%) 3 (18.8%) Coca Cocaine ine 114 (31.0%) 4 (25.0%) Opia Opiates tes 8 (2.1%) 2 (12.5%) Nega Negativ tive 210 (57.1%) 7 (43.8%) Clients who re-presented were more likely to test positive compared to clients who did not re-present. A quarter of re-presented clients (25.0%) tested positive for cocaine compared to just under a third of those who did not re-present (31.0%). Table K ble K6 6 – Freq – Frequen uency of re-pre cy of re-presentation o sentation of clients clients who tested po who tested positi sitive ve Re-pre Re-presentation sentation Fre Frequen quency (n=1 cy (n=169) 69) Nev Never r 160 (94.7%) Onc Once 8 (4.7%) Tw Twic ice e 1 (0.6%) Of the 169 clients who tested positive only nine re-presented (5.3%), eight testing positive on a further single occasion (4.7%) and one on a further two occasions (0.6%) between September and December 07.
SLIDE 15 Centre for Public Health, Faculty of Health and Applied Social Sciences, Liverpool John Moores University, Castle House, North Street, Liverpool, L3 2AY Tel: 0151 231 4544
7 Fi Fig 2: 2: K Know nowsley ey A Asessment ents -
Age ge (Apr pril 07 - 07 - D Dec ecem ember ber 07) 07)
29.8 1.2 20.0 6.7 0.0 16.5 21.9 11.2 6.6 12.8 26.7 13.3 13.3 20.0
5 10 15 20 25 30 35 under 25 25 - 29 30 - 34 35 - 39 40 - 44 45 - 49 50 and over
Age G ge Group
%
Did not re-present (n=242) Re-presented (n=15)
3.2 Assessments (DIRs) 3.2 Assessments (DIRs)
Table K ble K7 7 – Freq – Frequen uency of re-pre cy of re-presentation o sentation of clients clients who h who had d an an asse assessment sment co completed mpleted Re-pre Re-presentation sentation Fre Frequen quency cy (n=2 (n=257) 57) Nev Never r 242 (94.2%) Onc Once 12 (4.7%) 2 ti 2 times mes 3 (1.2%) Only 5.8% of assessed clients re-presented between April and December 07. Of the 15 re-presenting clients, 12 re-presented once with a further three re-presenting twice. Table K ble K8 - Re-p 8 - Re-pre resentation o sentation of clients b clients by ge gender nder Di Did not d not re-pre re-present (n=242) sent (n=242) Re-pre Re-presented (n=15) sented (n=15) Fem Female ale 28 (11.6%) 3 (20.0%) Ma Male le 214 (88.4%) 12 (80.0%) A fifth of all clients assessed who re-presented were female (20.0%). Clients who re-presented were generally older than those who did not. A lower proportion of clients assessed who re-presented (33.3%) were under 30 years of age, compared to those who did not re-present (51.7%). Just under half (46.7%) of all clients assessed who re-presented were between 30 and 39 years of age. This was much higher than among clients who did not re-present (29.3%).
SLIDE 16 Centre for Public Health, Faculty of Health and Applied Social Sciences, Liverpool John Moores University, Castle House, North Street, Liverpool, L3 2AY Tel: 0151 231 4544
8
Table K ble K9 -
e-pre resentation o sentation of clients b clients by e ethni hnicity city Di Did not d not re-pre re-present (n=241)* sent (n=241)* Re-pre e-presented (n=15) ented (n=15) Black Black 1 (0.4%) Whit White e 238 (98.8%) 15 (100.0%) Other Other 2 (0.8%)
*One client who did not re-present, did not provide information regarding their ethnicity.
The majority of all clients assessed who did (98.8%) and did not re-present (100.0%) were white. Table K ble K10 10 – Re-pre – Re-presentation sentation of
clients by offen
e Di Did not d not re-pre re-present (n=239)* sent (n=239)* Re-pre e-presented (n=15) ented (n=15) Brea Breach ch 9 (3.8%) Burgla Burglary ry 19 (7.9%) 1 (6.7%) Criminal Dam Criminal Damage ge 8 (3.3%) Fraud Fraud 9 (3.8%) Handling Handling 4 (1.7%) 2 (13.3%) MD MDA O Off ffences es 74 (31.0%) 2 (13.3%) Mo Motoring Offen toring Offences 5 (2.1%) Po Posse ssession sion of Offen
e Weapon apon 1 (0.4%) 1 (6.7%) Publi Public Orde Order Offence r Offence 4 (1.7%) Robbery Robbery 9 (3.8%) 2 (13.3%) Sho Shoplifting plifting 44 (18.4%) 5 (33.3%) The Theft ft 16 (6.7%) 2 (13.3%) The Theft - ft - Car Car 26 (10.9%) 2 (13.3%) War Warrant t 7 (2.9%) 2 (13.3%) Wounding or Wounding or Assaul Assault 16 (6.7%) Other Other 8 (3.3%) 2 (13.3%)
*Three clients who did not re-present did not provide information regarding their offence.
A higher proportion of re-presenting clients committed shoplifting (33.3%) compared to clients who did not re-present (18.4%). Table K ble K11– Drug u 11– Drug use in p e in past mo st month (n= nth (n=246) † 246) † Di Did not d not re-pre re-present (n=231)* sent (n=231)* Re-pre e-presented (n=15) ented (n=15) Amphetamine Amphetamine 5 (2.2%) 2 (13.3%) Benzodi Benzodiazepine azepine 8 (3.5%) 1 (6.7%) Ca Canna nnabis is 62 (26.8%) 3 (20.0%) Cra Crack ck 57 (24.7%) 8 (53.3%) Coca Cocaine ine 148 (64.1%) 4 (26.6%) Ecs Ecstasy asy 9 (3.9%) 1 (6.7%) Heroin Heroin 67 (29.0%) 9 (60.0%) Me Meth thadone adone 17 (7.4%) 1 (6.7%) Other Drug Other Drug 6 (2.6%)
† Proportions of drug use will not add up to 100% as clients can identify use of more than one drug at assessment. *11 clients who did not re-present were removed from analysis as they did use drugs in last month before assessment.
SLIDE 17 Centre for Public Health, Faculty of Health and Applied Social Sciences, Liverpool John Moores University, Castle House, North Street, Liverpool, L3 2AY Tel: 0151 231 4544
9
Analysis showed that clients who did not re-present were more likely to use cocaine (64.1%) than any other drug, whereas clients who re-presented were most likely to use heroin (60.0%). Furthermore, clients who re-presented were more likely to use crack (53.3%), than clients who did not re-present (24.7%). Table K ble K12 12 – Life – Lifetime injecting (n=246) time injecting (n=246) Di Did not d not re-pre re-present (n=231)* sent (n=231)* Re-pre Re-presented (n=15) sented (n=15) 32 (13.9%) 2 (13.3%)
*11 clients who did not re-present were removed from analysis as they did use drugs in last month before assessment.
The proportion of assessed clients who did (13.3%) and did not re-present (13.9%) who had ever injected was similar. Table K ble K13 - Re-pre 13 - Re-presentation sentation of
clients by accommod accommodatio tion Di Did not d not re-pre re-present (n=239)* sent (n=239)* Re-pre Re-presented (n=14)** sented (n=14)** Hos Hostel el 4 (1.7%) Own pro Own property perty 18 (7.5%) 1 (7.1%) Rented Rented 101 (42.3%) 5 (35.7%) Se Settled with ttled with Frie Friend nds s 2 (0.8%) 1 (7.1%) Sleep Sleep on diffe
rent friend's floo floor e r every night ery night 3 (1.3%) 1 (7.1%) Staying with Staying with friend friends/famil s/family as a short a short term terms s guest 39 (16.3%) 3 (21.4%) Other Other 72 (30.1%) 3 (21.4%)
*Three clients who did not re-present did not provide information regarding their accommodation. **One client who re-presented did not provide information regarding their accommodation.
Just over a third of clients (35.7%) who re-presented were in rented accommodation at the time of assessment, whereas just over four in ten clients (42.3%) who did not re- present were in rented accommodation. Table K ble K14 - Re-pre 14 - Re-presentation sentation of
clients by emplo employmen ment Di Did not d not re-pre re-present (n=239)* sent (n=239)* Re-pre Re-presented (n=15) sented (n=15) Ec Economica
lly Inactiv tive 7 (2.9%) Pupil/Student Pupil/Student 3 (1.3%) Regul Regular Emplo ar Employmen ment 66 (27.6%) 2 (13.3%) Unemplo Unemployed ed 159 (66.5%) 13 (86.7%) Other Other 4 (1.7%)
*Three clients who did not re-present did not provide information regarding their employment status.
A higher proportion of clients who re-presented (86.7%) were unemployed at the time of their assessment compared to those who did not re-present (66.5%). Moreover, there was a lower proportion of clients who re-presented (13.3%) who were in regular employment compared to those who did not re-present (27.6%).
SLIDE 18 Centre for Public Health, Faculty of Health and Applied Social Sciences, Liverpool John Moores University, Castle House, North Street, Liverpool, L3 2AY Tel: 0151 231 4544
10
3.3 Care Plans 3.3 Care Plans
Table K ble K15 15 – Fre – Frequen quency of cy of re-pre re-presen sentation o ation of clients clients who who h had d a a care pl care plan completed an completed Re-pre Re-presentation sentation Fre Frequen quency (n=6 cy (n=64) 4) Nev Never r 63 (98.4%) 2 ti 2 times mes 1 (1.6%) One client received a care plan more than once (1.6%) between April and December 07.
3.4 Transfers from Prison 3.4 Transfers from Prison
Table ble K16 – F K16 – Frequen equency o cy of re-presentation re-presentation of
clients who had a d a su succe ccessful tran sful transfer fer completed completed Re-pre Re-presentation sentation Fre Frequen quency (n=5 cy (n=53) 3) Nev Never r 48 (90.6%) 2 ti 2 times mes 5 (9.4%) Almost 10% of clients had a successful transfer completed more than once (9.4%).
SLIDE 19 Centre for Public Health, Faculty of Health and Applied Social Sciences, Liverpool John Moores University, Castle House, North Street, Liverpool, L3 2AY Tel: 0151 231 4544
11
3.5 Knowsley Summary 3.5 Knowsley Summary
Drug Testing Data
- Of the 384 clients who had a successful drug test completed, only 16 (4.2%) had
at least one more drug test completed between September and December 07.
- Analysis showed that clients who re-presented were less likely to be female than
clients who did not re-present.
- Clients who re-presented were older. Just under a third of clients who re-
presented were under 25 compared to just under four in ten of those who did not re-present.
- Offences committed were similar in both groups with theft being the most
- common. Re-presenting clients were more likely to commit burglary than their
non re-presenting counterparts.
- Clients who re-presented were more likely to test positive than those who did not
re-present. Assessments (DIRs)
- Of the 15 clients who re-presented, 12 clients re-presented once (4.7%) with
three clients re-presenting twice (1.2%) between April and December 07.
- Those that re-presented were older than those who did not re-present.
- A third of re-presenting clients committed shoplifting compared to just under a
quarter of those who did not re-present.
- Assessed clients who re-presented were more likely to use crack and heroin
compared to those who did not re-present. A lower proportion of cocaine users were found among re-presenting clients than among clients who did not re- present.
- Similar proportions of clients in both groups had injected in their lifetime.
- Re-presenting clients were more likely to be unemployed at the time of
assessment compared to those who did not re-present.
- The accommodation status of the two groups was relatively similar; however,
there was a slightly higher rate of rented accommodation among those who did not re-present, compared to those who re-presented.
SLIDE 20 Centre for Public Health, Faculty of Health and Applied Social Sciences, Liverpool John Moores University, Castle House, North Street, Liverpool, L3 2AY Tel: 0151 231 4544
12
4.0 Liverpool 4.0 Liverpool
4.1 Drug Testing Data 4.1 Drug Testing Data
Table L1 ble L1 – Fre – Frequen quency of cy of re-pre re-presentation of sentation of clients clients who h who had d a a succe successful drug test ssful drug test completed completed Re-pre Re-presentation sentation Fre Frequen quency (n=3 cy (n=3171) 171) Nev Never r 2728 (86.0%) Onc Once 293 (9.2%) 2 ti 2 times mes 91 (2.9%) 3 ti 3 times mes 32 (1.0%) 4 ti 4 times mes 12 (0.4%) 5 ti 5 times mes 7 (0.2%) 6 ti 6 times mes 3 (0.1%) 7 ti 7 times mes 1 (<0.1%) 8 ti 8 times mes 1 (<0.1%) 9 ti 9 times mes 1 (<0.1%) 10 time 10 times s 2 (0.1%) The majority of clients only had one test completed (86.0%) between April and December
- 07. There were 443 clients who had a successful drug test completed who subsequently
re-presented at least once (14.0%) between April and December 07. Of those clients who re-presented, 293 clients re-presented once during the time period (9.2%), with a further 91 clients re-presenting twice (2.9%). Clients re-presented a maximum of 10 times during nine months reported. Table L2 ble L2 - Re-p
resentation o sentation of clients b clients by ge gender nder Di Did not d not re-pre re-present (n=2728) sent (n=2728) Re-pre Re-presented (n=443) sented (n=443) Fem Female ale 598 (21.9%) 76 (17.2%) Ma Male le 2130 (78.1%) 367 (82.8%) A lower proportion of clients who re-presented were female (17.2%) compared to those who did not re-present (21.9%).
SLIDE 21 Centre for Public Health, Faculty of Health and Applied Social Sciences, Liverpool John Moores University, Castle House, North Street, Liverpool, L3 2AY Tel: 0151 231 4544
13
Fig 3: Li Liver verpool
Succ ccessf sful ul D Drug Te ug Tests -
(Apr pril 07 - 07 - Decem ecember er 07 07)
9.6 5.5 5.6 6.2 12.1 16.3 37.6 12.8 18.1 3.2 29.8 13.1 18.1 12.2
0.0 5.0 10.0 15.0 20.0 25.0 30.0 35.0 40.0 under 25 25 - 29 30 - 34 35 - 39 40 - 44 45 - 49 50 and
Ag Age G Group %
Did not re-present (n=2728) Re-presented (n=443)
Clients who re-presented were generally older than those who did not re-present. Just under three in ten (29.8%) clients who re-presented were under 25 compared to just under four in ten (37.6%) of those who did not. Of those clients who re-presented, just
- ver a third (36.2%) were aged between 30 and 39, compared to just under a quarter of
clients (24.9%) who did not re-present. Table L3 ble L3 - Re-p
resentation o sentation of clients b clients by e ethni hnicity city Di Did not d not re-pre re-present (n=2669)* sent (n=2669)* Re-pre Re-presented (n=439)** sented (n=439)** Black Black 44 (1.6%) 4 (0.9%) Whit White e 2502 (93.7%) 421 (95.9%) Mi Mixed xed 67 (2.5%) 10 (2.3%) Other Other 56 (2.1%) 4 (0.9%)
*59 clients who did not re-present did not provide information regarding their ethnicity. **Four clients who re-presented did not provide information regarding their ethnicity.
The majority of clients among those who did (95.9%) and did not re-present (93.7%) were white.
SLIDE 22 Centre for Public Health, Faculty of Health and Applied Social Sciences, Liverpool John Moores University, Castle House, North Street, Liverpool, L3 2AY Tel: 0151 231 4544
14
Table L4 ble L4 - Re-p
resentation o sentation of clients b clients by o
ffence e Di Did not d not re-pre re-present (n=2728) sent (n=2728) Re-pre Re-presented (n=443) sented (n=443) Begging Begging 34 (1.2%) 29 (6.5%) Burgla Burglary ry 325 (11.9%) 61 (13.8%) De Deception ception 55 (2.0%) 6 (1.4%) Fraud Fraud 77 (2.8%) 2 (0.5%) Going equipped Going equipped 9 (0.3%) 9 (2.0%) Handling stolen Handling stolen go good
s 78 (2.9%) 5 (1.1%) MD MDA of
nces es 622 (22.8%) 51 (11.5%) Non-Trigge Non-Trigger Offen r Offences 34 (1.2%) 3 (0.7%) Robbery Robbery 127 (4.7%) 24 (5.4%) The Theft ft 1318 (48.3%) 249 (56.2%) Vehi Vehicle T cle Taking king 49 (1.8%) 4 (0.9%) There was a higher proportion of clients who re-presented (56.2%) who had committed theft than those who did not re-present (48.3%). The opposite was evident with MDA
- ffences in that there was a higher proportion of those who did not re-present (22.8%)
than those who re-presented (11.5%) who had committed this type of offence. Furthermore, there were higher proportions of clients who had re-presented who committed begging (6.5%) and burglary (13.8%), than those who did not re-present (1.2% and 11.9% respectively). Table L5 ble L5 – Te – Test st Re Result sult Di Did not d not re-pre re-present (n=2728) sent (n=2728) Re-pre Re-presented (n=443) sented (n=443) Both ( th (Co Cocaine caine and and O Opiate iates) s) 375 (13.7%) 177 (40.0%) Coca Cocaine ine 673 (24.7%) 88 (19.9%) Opia Opiates tes 126 (4.6%) 30 (6.8%) Nega Negativ tive 1554 (57.0%) 148 (33.4%) Re-presenting clients were more likely to test positive at their first test (66.6%) than their non re-presenting counterparts (43.0%). Clients who re-presented were more likely to test positive for both cocaine and opiates (40.0%) and opiates only (6.8%) compared to those who did not re-present (13.7% and 4.6%). In contrast, a lower proportion of clients who re-presented tested positive for cocaine only at their first test (19.9%) compared to those who did not re-present (24.7%).
SLIDE 23 Centre for Public Health, Faculty of Health and Applied Social Sciences, Liverpool John Moores University, Castle House, North Street, Liverpool, L3 2AY Tel: 0151 231 4544
15
Table L6 ble L6 - Freque
ncy of re-p
resentation o sentation of f clients clients who who te tested po sted positi sitive ve Re-pre Re-presentation sentation Fre Frequen quency (n=1 cy (n=1515) 515) Nev Never r 1263 (83.4%) Onc Once 160 (10.6%) 2 ti 2 times mes 58 (3.8%) 3 ti 3 times mes 16 (1.1%) 4 ti 4 times mes 9 (0.6%) 5 ti 5 times mes 2 (0.1%) 6 ti 6 times mes 3 (0.2%) 7 ti 7 times mes 1 (0.1%) 8 ti 8 times mes 1 (0.1%) 9 ti 9 times mes 1 (0.1%) 10 time 10 times s 1 (0.1%) The majority of clients who tested positive did not re-present (83.4%). Of the 252 clients who tested positive, 160 (10.6%) re-presented once between April and December 07, with 58 clients re-presenting twice (3.8%). The maximum number of times clients re- presented and tested positive was 10.
SLIDE 24 Centre for Public Health, Faculty of Health and Applied Social Sciences, Liverpool John Moores University, Castle House, North Street, Liverpool, L3 2AY Tel: 0151 231 4544
16 Fi Fig 4: 4: Li Liver verpoo
Assess sessments -
(A (April 0 07 -
07)
29.9 16.7 5.0 11.9 14.3 16.8 1.4 17.9 12.0 16.2 2.4 27.6 23.1 4.9 0.0 5.0 10.0 15.0 20.0 25.0 30.0 35.0 under 25 25 - 29 30 - 34 35 - 39 40 - 44 45 - 49 50 and
Age G e Grou
%
Did not re-present (n=1312) Re-presented (n=286)
4.2 Assessments (DIRs) 4.2 Assessments (DIRs)
Table L7 ble L7 – Freq – Frequen uency of re-pre cy of re-presentation o sentation of clients clients who h who had d an an asse assessment sment co completed mpleted Re-pre Re-presentation sentation Fre Frequen quency (n=1 cy (n=1598) 598) Nev Never r 1312 (82.1%) Onc Once 187 (11.7%) 2 ti 2 times mes 58 (3.6%) 3 ti 3 times mes 29 (1.8%) 4 ti 4 times mes 4 (0.3%) 5 ti 5 times mes 7 (0.4%) 9 ti 9 times mes 1 (0.1%) Just under a fifth of all assessed clients (17.9%) re-presented between April and December 07. Assessed clients re-presented a maximum of 9 times (1 client). Of the 286 clients who re-presented, 187 clients re-presented once (11.7%), with 58 clients re- presenting twice (3.6%). Table L8 ble L8 - Re-p
resentation o sentation of clients b clients by ge gender nder Di Did not d not re-pre re-present (n=1312) sent (n=1312) Re-pre Re-presented (n=286) sented (n=286) Fem Female ale 239 (18.2%) 69 (24.1%) Ma Male le 1073 (81.8%) 217 (75.9%) Just under a quarter of all assessed clients who re-presented were female (24.1%), compared to just under a fifth of those who did not re-present (18.2%). Clients who re-presented were generally older than those who did not re-present. A considerably lower proportion of clients who re-presented were under 25 years of age
SLIDE 25 Centre for Public Health, Faculty of Health and Applied Social Sciences, Liverpool John Moores University, Castle House, North Street, Liverpool, L3 2AY Tel: 0151 231 4544
17
(11.9%) compared to those who did not re-present (29.9%). Moreover, there was a much higher proportion of clients who re-presented (67.5%) than those who did not re-present (46.1%) who were between 30 and 44 years old. Table L9 ble L9 - Re-p
resentation o sentation of clients b clients by e ethni hnicity city Di Did not d not re-pre re-present (n=1306)* sent (n=1306)* Re-pre Re-presented (n=284)** sented (n=284)** Black Black 37 (2.8%) 9 (3.2%) Mi Mixed xed 28 (2.1%) 12 (4.2%) Whit White e 1231 (94.3%) 262 (92.3%) Other Other 10 (0.8%) 1 (0.4%)
*Six clients who did not re-present did not provide information regarding their ethnicity. **Two clients who re-presented did not provide information regarding their ethnicity.
The majority of all clients assessed, both those who did not re-present (94.3%) and those who did (92.3%), were white. Table L1 ble L10 0 – Re-pre – Re-presentation sentation of
clients by offen
e Di Did not d not re-pre re-present (n=1309)* sent (n=1309)* Re-pre e-presented (n=282)** ented (n=282)** Begging Begging 19 (1.5%) 14 (5.0%) Brea Breach ch 42 (3.2%) 20 (7.1%) Burgla Burglary ry 123 (9.4%) 20 (7.1%) Criminal Dam Criminal Damage ge 10 (0.8%) 1 (0.4%) Fraud Fraud 25 (1.9%) 1 (0.4%) Handling Handling 33 (2.5%) 3 (1.1%) MD MDA O Off ffences es 403 (30.8%) 33 (11.7%) Mo Motoring Offen toring Offences 18 (1.4%) 2 (0.7%) Po Posse ssession sion of Offen
e Weapon apon 8 (0.6%) 4 (1.4%) Publi Public Orde Order Offence r Offence 21 (1.6%) 3 (1.1%) Robbery Robbery 69 (5.3%) 13 (4.6%) Sho Shoplifting plifting 258 (19.7%) 117 (41.5%) The Theft ft 100 (7.6%) 21 (7.4%) The Theft - ft - Car Car 139 (10.6%) 20 (7.1%) War Warrant t 57 (4.4%) 27 (9.6%) Wounding or Wounding or Assaul Assault 30 (2.3%) 2 (0.7%) Other Other 32 (2.4%) 8 (2.8%)
*Seven clients who did not re-present did not provide information regarding their offence. **Four clients who re-presented did not provide information regarding their offence.
A larger proportion of clients who re-presented committed shoplifting (41.5%) compare to those who did not re-present (19.7%). Moreover, higher proportions of re-presenting clients had committed begging (5.0%) and breach offences (7.1%) compared to their non re-presenting counterparts (1.5% and 3.2% respectively). Clients who re-presented were less likely than their counterparts who did not re-present to have committed MDA
- ffence (11.7% compared to 30.8%). A higher proportion of re-presenting clients
committed car theft (10.6%) compared to their non re-presenting counterparts (7.1%).
SLIDE 26 Centre for Public Health, Faculty of Health and Applied Social Sciences, Liverpool John Moores University, Castle House, North Street, Liverpool, L3 2AY Tel: 0151 231 4544
18
Table L1 ble L11 1 – Drug u – Drug use in p e in past mo st month (n= nth (n=1466) 1466) †
†
Di Did not d not re-pre re-present (n=1186)* sent (n=1186)* Re-pre Re-presented (n=280)** sented (n=280)** Amphetamine Amphetamine 10 (0.8%) 1 (0.4%) Benzodi Benzodiazepine azepine 23 (1.9%) 11 (3.9%) Ca Canna nnabis is 256 (21.6%) 18 (6.4%) Coca Cocaine ine 602 (50.8%) 52 (18.6%) Cra Crack ck 413 (34.8%) 197 (70.4%) Ecs Ecstasy asy 26 (2.2%) 1 (0.4%) Heroin Heroin 496 (41.8%) 215 (76.8%) Me Meth thadone adone 44 (3.7%) 15 (5.4%) Other Drug Other Drug 11 (0.9%) 8 (2.9%)
† Proportions of drug use will not add up to 100% as clients can identify use of more than one drug at assessment. *126 clients who did not re-present were removed from analysis as they did not use drugs in last month before assessment. **Six clients who re-presented were removed from analysis as they did not use drugs in last month before assessment.
A higher proportion of clients who re-presented had used heroin (76.8%) and crack (70.4%) in the month prior to assessment compared to those who did not re-present (41.8% and 34.8% respectively). However, there were greater proportions of cocaine (50.8%) and cannabis (21.6%) users among those who did not re-present compared to those who did (18.6% and 6.4%). Table L1 ble L12 - Life 2 - Lifetime injecting (n=1466) time injecting (n=1466) Di Did not d not re-pre re-present (n=1186)* sent (n=1186)* Re-pre Re-presented (n=280)** sented (n=280)** 313 (26.4%) 147 (52.5%)
*126 clients who did not re-present were removed from analysis as they did not use drugs in last month before assessment. **Six clients who re-presented were removed from analysis as they did not use drugs in last month before assessment.
A considerably higher proportion of clients who re-presented (52.5%) reported having ever injecting compared to those who did not re-present (26.4%). Table L1 ble L13 - Re-pre 3 - Re-presentation sentation of
clients by accommod accommodatio tion Di Did not d not re-pre re-present (n=1290)* sent (n=1290)* Re-pre Re-presented (n=284)** sented (n=284)** Hos Hostel el 42 (3.3%) 21 (7.4%) Rented Rented 777 (60.2%) 166 (58.5%) Own pro Own property perty 224 (17.4%) 24 (8.5%) Se Settled with ttled with Frie Friend nds s 8 (0.6%) 6 (2.1%) Sleep Sleep on diffe
rent friend's floo floor e r every night ery night 19 (1.5%) 7 (2.5%) Sleep Sleep on
streets 20 (1.6%) 10 (3.5%) Staying with Staying with friend friends/famil s/family as a short a short term terms s guest 100 (7.8%) 31 (10.9%) Other Other 100 (7.8%) 19 (6.7%)
*22 clients who did not re-present did not provide information regarding their accommodation. **Two clients who re-presented did not provide information regarding their accommodation.
There were lower proportions of clients who re-presented in rented (58.5%) or privately
- wned (8.5%) accommodation at the time of assessment compared to those who did not
SLIDE 27 Centre for Public Health, Faculty of Health and Applied Social Sciences, Liverpool John Moores University, Castle House, North Street, Liverpool, L3 2AY Tel: 0151 231 4544
19
re-present (60.2% and 17.4%). Moreover, higher proportions of re-presenting clients lived in a hostel (7.4%) or were staying with friends as a short term guest (10.9%), than among those who did not re-present (3.3% and 7.8% respectively). Table L1 ble L14 4 – Re-pre – Re-presentation sentation of
clients by emplo employmen ment Di Did not d not re-pre re-present (n=1285)* sent (n=1285)* Re-pre Re-presented (n=285)** sented (n=285)** Economically inacti Economically inactive ve 122 (9.5%) 35 (12.3%) Pupil/student Pupil/student 24 (1.9%) Regul Regular emplo ar employmen ment 291 (22.6%) 14 (4.9%) Unemplo Unemployment ment 808 (62.9%) 222 (77.9%) Other Other 40 (3.1%) 14 (4.9%)
*27 clients who did not re-present did not provide information regarding their employment status. **One client who re-presented did not provide information regarding their employment status.
There was a higher proportion of unemployed clients among those who re-presented (77.9%) than those who did not (62.9%). Conversely, clients who did not re-present (22.6%) were more likely to be in regular employment than their re-presenting counterparts (4.9%).
SLIDE 28
Centre for Public Health, Faculty of Health and Applied Social Sciences, Liverpool John Moores University, Castle House, North Street, Liverpool, L3 2AY Tel: 0151 231 4544
20
4.3 Care Plans 4.3 Care Plans
Table L1 ble L15 - Fre 5 - Frequen quency of cy of re-pre re-presen sentation o ation of clients clients who who h had d a a care pl care plan completed an completed Re-pre Re-presentation sentation Fre Frequen quency (n=3 cy (n=337) 37) Nev Never r 299 (88.7%) Onc Once 33 (9.8%) 2 ti 2 times mes 4 (1.2%) 3 ti 3 times mes 1 (0.3%) There were 37 clients (9.8%) who had more than one care plan completed between April and December 07. Five clients (1.5%) who had a care plan completed re-presented more than once during this period. Only one client re-presented three times.
4.4 Transfers from Prison 4.4 Transfers from Prison
Table L16 - Frequ ble L16 - Frequency of re-p ency of re-pre resentation of sentation of clients who h clients who had a d a succe successful tran ssful transfe sfer r completed completed Re-pre Re-presentation sentation Fre Frequen quency (n=2 cy (n=256) 56) Nev Never r 237 (92.6%) Onc Once 17 (6.6%) 2 ti 2 times mes 2 (0.8%) The majority of clients who had a successful transfer from prison completed did not re- present (92.6%). Of the 19 clients who had a successful transfer completed, 17 re- presented once (6.6%), with two re-presenting twice (0.8%).
SLIDE 29 Centre for Public Health, Faculty of Health and Applied Social Sciences, Liverpool John Moores University, Castle House, North Street, Liverpool, L3 2AY Tel: 0151 231 4544
21
4.5 Liverpool Summary 4.5 Liverpool Summary
Drug Testing Data
- Of the 3171 clients who had a successful drug test completed, 443 (14.0%) re-
presented between April and December 07.
- Clients who re-presented were less likely to be female than clients who did not re-
present.
- Re-presenting clients were more likely to be older than their non re-presenting
- counterparts. Furthermore, just over a quarter of re-presenting clients were under
25 at the time of their drug test compared just over a third of those who did not re-present.
- The most common offence committed by clients who re-presented was theft. Re-
presenting clients were more likely than their non re-presenting counterparts to have committed theft, begging and burglary but were less likely to have committed MDA offences.
- Clients who re-presented were more likely to test positive than clients who did
not re-present. Moreover, re-presenting clients were more likely to test positive for opiates and cocaine combined than those who did not re-present. Assessments (DIRs)
- Of the 1598 clients who had an assessment completed, 286 re-presented
between April and December 07.
- The proportion of female clients was greater among clients who re-presented
compared to those who did not re-present.
- Clients who re-presented were older than those who did not re-present.
- Re-presenting clients were more likely to have committed begging, breach
- ffences and shoplifting compared to their non re-presenting counterparts. A
different offence profile was found for those who did not re-present, with clients more likely to commit burglary, care theft and MDA offences.
- Clients who re-presented reported potentially more problematic drug use profiles
with greater proportions using heroin and crack and a much greater proportion having a history of injecting behaviour. In contrast, rates of use of cocaine and cannabis were much higher among clients who did not re-present.
- Clients who re-presented were less likely to be in potentially more stable
accommodation such as rented or owned property than their non re-presenting counterparts.
SLIDE 30 Centre for Public Health, Faculty of Health and Applied Social Sciences, Liverpool John Moores University, Castle House, North Street, Liverpool, L3 2AY Tel: 0151 231 4544
22
- Clients who re-presented were more likely to be unemployed at the time of their
first assessment than clients who did not.
SLIDE 31 Centre for Public Health, Faculty of Health and Applied Social Sciences, Liverpool John Moores University, Castle House, North Street, Liverpool, L3 2AY Tel: 0151 231 4544
23
Fi Fig 5 g 5: Se Sefton
ul Drug T Tests - A Age (A (April 0 07 - D
39.1 8.9 5.2 18.7 14.5 10.5 5.0 3.7 6.1 10.4 16.8 13.6 32.6 15.0
0.0 5.0 10.0 15.0 20.0 25.0 30.0 35.0 40.0 45.0 under 25 25 - 29 30 - 34 35 - 39 40 - 44 45 - 49 50 and
Age G ge Group
%
Did not re-present (n=788) Re-presented (n=380)
5.0 Sefton 5.0 Sefton
5.1 Drug Testing Data 5.1 Drug Testing Data
Table ble S1 - Fre S1 - Frequen quency of re-p cy of re-presentatio resentation of n of clients who clients who had a su a succe ccessful sful drug te rug test st completed completed Re-pre Re-presentation sentation Fre Frequen quency (n=1 cy (n=1168) 168) Nev Never r 788 (67.5%) Onc Once 299 (25.6%) 2 ti 2 times mes 37 (3.2%) 3 ti 3 times mes 20 (1.7%) 4 ti 4 times mes 10 (0.9%) 5 ti 5 times mes 9 (0.8%) 6 ti 6 times mes 3 (0.3%) 7 ti 7 times mes 2 (0.2%) Just under a third of clients who had a drug test completed between April and December 07 re-presented (32.5%). Of the 1168 clients who had a successful drug test completed, just over a quarter (25.6%) re-presented once. There were 81 clients (6.9%) who re- presented more than once during the time period analysed. Table S ble S2 - Re-p 2 - Re-pre resentation o sentation of clients b clients by ge gender nder Di Did not d not re-pre re-present (n=788) sent (n=788) Re-pre Re-presented (n=380) sented (n=380) Fem Female ale 157 (19.9%) 84 (22.1%) Ma Male le 631 (80.1%) 296 (77.9%) Just under a quarter of clients (22.1%) who re-presented were female, compared to just under a fifth of those who did not re-present (19.9%).
SLIDE 32 Centre for Public Health, Faculty of Health and Applied Social Sciences, Liverpool John Moores University, Castle House, North Street, Liverpool, L3 2AY Tel: 0151 231 4544
24
Clients who re-presented were slightly older than their non re-presenting counterparts. Almost a third of clients (32.6%) who re-presented were under 25 years of age compared to 39.1% of those who did not. There was a higher proportion of clients who re- presented (43.7%) than those who did not re-present (32.9%) who were between 30 and 44. Table S ble S3 – Re-p – Re-pre resentation o sentation of clients b clients by e ethni hnicity city Di Did not d not re-pre re-present (n=787)* sent (n=787)* Re-pre Re-presented (n=380) sented (n=380) Whit White e 776 (98.6%) 380 (100.0%) Other Other 11 (1.4%)
*One client who did not re-present did not provide information regarding their ethnicity.
All clients who re-presented were white (100.0%) Table S ble S4 4 – Re-p – Re-pre resentation o sentation of clients b clients by o
ffence e Di Did not d not re-pre re-present (n=788) sent (n=788) Re-pre Re-presented (n=380) sented (n=380) Burgla Burglary ry 105 (13.3%) 62 (16.3%) Fraud Fraud 14 (1.8%) 9 (2.4%) Handling stolen Handling stolen go good
s 9 (1.1%) 10 (2.6%) MD MDA of
nces es 141 (17.9%) 43 (11.3%) Non-Trigge Non-Trigger Offen r Offences 15 (1.9%) 6 (1.6%) Robbery Robbery 28 (3.6%) 15 (3.9%) The Theft ft 448 (56.9%) 221 (58.2%) Vehi Vehicle T cle Taking king 16 (2.0%) 4 (1.1%) Other Other 12 (1.5%) 10 (2.6%) The most common offence for clients in both groups was theft (58.2% and 56.9%). A lower proportion of re-presenting clients (11.3%) had committed MDA offences compared to those who did not re-present (17.9%). There was a higher proportion of re- presenting clients who committed burglary than their non re-presenting counterparts (16.3% compared to 13.3%). Table S ble S5 5 – Te – Test st Re Result sult Di Did not d not re-pre re-present (n=788) sent (n=788) Re-pre Re-presented (n=380) sented (n=380) Both ( th (Co Cocaine caine and and O Opiate iates) s) 96 (12.2%) 104 (27.4%) Coca Cocaine ine 235 (29.8%) 79 (20.8%) Opia Opiates tes 27 (3.4%) 20 (5.3%) Nega Negativ tive 430 (54.6%) 177 (46.6%) Clients who re-presented were more likely to test positive than clients who did not. Just
- ver a quarter of clients (27.4%) who re-presented tested positive for both cocaine and
- piates, compared to 12.2% of clients who did not re-present. Clients who did not re-
present were more likely to test positive for cocaine only (29.8%) than their re-presenting counterparts (20.8%).
SLIDE 33 Centre for Public Health, Faculty of Health and Applied Social Sciences, Liverpool John Moores University, Castle House, North Street, Liverpool, L3 2AY Tel: 0151 231 4544
25
Table S ble S6 - Freque
ncy of re-p
resentation o sentation of f clients clients who who te tested po sted positi sitive ve Re-pre Re-presentation sentation Fre Frequen quency (n=5 cy (n=571) 71) Nev Never r 375 (65.7%) Onc Once 142 (24.9%) 2 ti 2 times mes 19 (3.3%) 3 ti 3 times mes 16 (2.8%) 4 ti 4 times mes 9 (1.6%) 5 ti 5 times mes 6 (1.1%) 6 ti 6 times mes 3 (0.5%) 7 ti 7 times mes 1 (0.2%) Just over a third of clients (34.3%) who tested positive re-presented between April and December 07. Of the clients who tested positive, 196 re-presented at least once but no more than seven times, with 142 re-presenting only once during the time period. Just
- ver 5% of clients re-presented two (3.3%) or three times (2.8%) during the time period.
Only one client re-presented seven times.
SLIDE 34 Centre for Public Health, Faculty of Health and Applied Social Sciences, Liverpool John Moores University, Castle House, North Street, Liverpool, L3 2AY Tel: 0151 231 4544
26
Fi Fig 6: g 6: Sef Sefton A
ents -
Age ge (April 07 - 7 - D Decem ember ber 07) 07)
30.5 6.0 1.2 16.1 25.0 25.0 14.3 14.6 11.8 18.2 17.7 8.9 3.6 7.1
0.0 5.0 10.0 15.0 20.0 25.0 30.0 35.0 under 25 25 - 29 30 - 34 35 - 39 40 - 44 45 - 49 50 and
Age G ge Group
%
Did not re-present (n=417) Re-presented (n=56)
5.2 Assessments (DIRs) 5.2 Assessments (DIRs)
Table S ble S7 - Freque
ncy of re-p
resentation o sentation of clients who had clients who had an asse an assessment com sment completed pleted Re-pre Re-presentation sentation Fre Frequen quency (n=4 cy (n=473) 73) Nev Never r 417 (88.2%) Onc Once 43 (9.1%) 2 ti 2 times mes 11 (2.3%) 3 ti 3 times mes 1 (0.2%) 4 ti 4 times mes 1 (0.2%) Just over a tenth of clients re-presented between April and December 07 after an initial assessment was completed. Assessed clients re-presented a maximum of four times during the analysed time period, with only two clients re-presenting more than twice (0.4%). There were 43 clients (9.1%) who re-presented once between April and December 07. Table S ble S8 - Re-p 8 - Re-pre resentation o sentation of clients b clients by ge gender nder Di Did not d not re-pre re-present (n=417) sent (n=417) Re-pre Re-presented (n=56) sented (n=56) Fem Female ale 93 (22.3%) 17 (30.4%) Ma Male le 324 (77.7%) 39 (69.6%) Almost a third of all clients assessed who re-presented were female (30.4%) compared to just under a quarter (22.3%) of those who did not re-present. Generally clients who re-presented were older than their non-re-presenting counterparts. A much lower proportion of assessed clients who re-presented (8.9%) were under 25 years of age, than among those who did not re-present (30.5%). Furthermore, half of the
SLIDE 35 Centre for Public Health, Faculty of Health and Applied Social Sciences, Liverpool John Moores University, Castle House, North Street, Liverpool, L3 2AY Tel: 0151 231 4544
27
clients who re-presented (64.3%) were between 30 and 44 years of age compared to
- nly 47.7% of those who did not re-present.
Table S ble S9 - Re-p
resentation o sentation of clients b clients by e ethni hnicity city Di Did not d not re-pre re-present (n=414)* sent (n=414)* Re-pre Re-presented (n=56) sented (n=56) Black Black 3 (0.7%) Whit White e 410 (99.0%) 55 (98.2%) Other Other 1 (0.2%) 1 (1.8%)
*Three clients who did not re-present did not provide information regarding their ethnicity.
The majority of all assessed clients were white. Table S ble S10 10 – Re-pre – Re-presentation sentation of
clients by offen
e Di Did not d not re-pre re-present (n=417)* sent (n=417)* Re-pre e-presented (n=54)** ented (n=54)** Begging Begging 4 (1.0%) Brea Breach ch 11 (2.6%) 3 (5.6%) Burgla Burglary ry 44 (10.6%) 4 (7.4%) Fraud Fraud 9 (2.2%) 1 (1.9%) Handling Handling 5 (1.2%) 3 (5.6%) MD MDA O Off ffences es 104 (24.9%) 6 (11.1%) Mo Motoring Offen toring Offences 4 (1.0%) Po Posse ssession sion of Offen
e Weapon apon 1 (0.2%) Publi Public Orde Order Offence r Offence 3 (0.7%) Robbery Robbery 10 (2.4%) Sho Shoplifting plifting 141 (33.8%) 35 (64.8%) The Theft ft 33 (7.9%) 4 (7.4%) The Theft - ft - Car Car 41 (9.8%) War Warrant t 5 (1.2%) Wounding or Wounding or Assaul Assault 8 (1.9%) Other Other 9 (2.2%)
*Two clients who did not re-present did not provide information regarding their offence. **One client who re-presented did not provide information regarding their offence.
Almost double the proportion of clients who re-presented had committed shoplifting (64.8%) compared to those who did not re-present (33.8%). A lower proportion of re- presenting clients committed MDA (11.1%) and burglary offences (7.4%) compared to their non re-presenting counterparts (24.9% and 10.6% respectively).
SLIDE 36 Centre for Public Health, Faculty of Health and Applied Social Sciences, Liverpool John Moores University, Castle House, North Street, Liverpool, L3 2AY Tel: 0151 231 4544
28
Table S ble S11 11 – Drug u – Drug use in p e in past mo st month (n= nth (n=447) 447) †
†
Di Did not d not re-pre re-present (n=395)* sent (n=395)* Re-pre Re-presented (n=52)** sented (n=52)** Amphetamine Amphetamine 3 (0.8%) Benzodi Benzodiazepine azepine 11 (2.8%) 2 (3.8%) Ca Canna nnabis is 62 (15.7%) 3 (5.8%) Cra Crack ck 124 (31.4%) 24 (46.2%) Coca Cocaine ine 205 (51.9%) 11 (21.2%) Ecs Ecstasy asy 6 (1.5%) Heroin Heroin 176 (44.6%) 43 (82.7%) Me Meth thadone adone 22 (5.6%) 1 (1.9%) Other Drug Other Drug 7 (1.8%)
† Proportions of drug use will not add up to 100% as clients can identify use of more than one drug at assessment. *22 clients who did not re-present were removed from analysis as they did not use drugs in last month before assessment. **Four clients who re-presented were removed from analysis as they did not use drugs in last month before assessment.
There were considerably higher proportions of clients who re-presented who used heroin (82.7%) and crack (46.2%) compared to those who did not re-present (44.6% and 31.4% respectively). Conversely, clients who re-presented were less likely than those who did not re-present to use cocaine (21.2% re-presented, 51.9% did not re-present) and cannabis (5.8% re-presented, 15.7% did not re-present). Table S ble S12 - Life 12 - Lifetime injecting (n=447) time injecting (n=447) Di Did not d not re-pre re-present (n=395)* sent (n=395)* Re-pre Re-presented (n=52)** sented (n=52)** 113 (28.6%) 30 (57.7%)
*22 clients who did not re-present were removed from analysis as they did not use drugs in last month before assessment. **Four clients who re-presented were removed from analysis as they did not use drugs in last month before assessment.
Over half of re-presenting clients who used drugs in the last month indicated injecting in their lifetime (57.7%) compared to just over a quarter (28.6%) of those who did not re- present. Table ble S13 – 13 – Re-pre Re-presentation of clients sentation of clients by accommod accommodatio tion Di Did not d not re-pre re-present (n=413)* sent (n=413)* Re-pre Re-presented (n=55)** sented (n=55)** Hos Hostel el 11 (2.7%) 4 (7.3%) Rented Rented 210 (50.8%) 30 (54.5%) Own pro Own property perty 71 (17.2%) 4 (7.3%) Se Settled with ttled with Frie Friend nds s 6 (1.5%) 3 (5.5%) Sleep Sleep on diffe
rent friend's floo floor e r every night ery night 6 (1.5%) Sleep Sleep on
streets 3 (0.7%) 1 (1.8%) Staying with Staying with friend friends/famil s/family as a short a short term terms s guest 54 (13.1%) 7 (12.7%) Other Other 52 (12.6%) 6 (10.9%)
*Four clients who did not re-present did not provide information regarding their accommodation. **One client who re-presented did not provide information regarding their accommodation.
Over half of the clients who re-presented (54.5%) and those that did not (50.8%) were in rented accommodation at the time of assessment. Lower proportions of clients who re-
SLIDE 37 Centre for Public Health, Faculty of Health and Applied Social Sciences, Liverpool John Moores University, Castle House, North Street, Liverpool, L3 2AY Tel: 0151 231 4544
29
presented (7.3%) lived in owned property compared to those who did not re-present (17.2%). Higher proportions of re-presenting clients (7.3%) were resident in hostels at the time of assessment than among their counterparts who did not re-present (2.7%). Table S ble S14 14 – Re-pre – Re-presentation sentation of
clients by emplo employmen ment Di Did not d not re-pre re-present (n=414)* sent (n=414)* Re-pre Re-presented (n=55)** sented (n=55)** Economically inacti Economically inactive ve 38 (9.2%) 7 (12.7%) Pupil/student Pupil/student 9 (2.2%) Regul Regular Emplo ar Employmen ment 94 (22.7%) 6 (10.9%) Unemplo Unemployed ed 260 (62.8%) 40 (72.7%) Other Other 13 (3.1%) 2 (3.6%)
*Three clients who did not re-present did not provide information regarding their employment status. **One client who re-presented did not provide information regarding their employment status.
A higher proportion of clients who re-presented (72.7%) were unemployed compared to those who did not re-present (62.8%). A greater proportion of clients who did not re- present (22.7%) reported having regular employment compared to those who re- presented (10.9%).
SLIDE 38 Centre for Public Health, Faculty of Health and Applied Social Sciences, Liverpool John Moores University, Castle House, North Street, Liverpool, L3 2AY Tel: 0151 231 4544
30
5.3 Care Plans 5.3 Care Plans
Table S ble S15 - Fre 15 - Frequen quency of cy of re-pre re-presen sentation o ation of clients clients who who h had d a a care pl care plan completed an completed Re-pre Re-presentation sentation Fre Frequen quency (n=1 cy (n=194) 94) Nev Never r 181 (93.3%) Onc Once 9 (4.6%) 2 ti 2 times mes 4 (2.1%) The majority of clients who had a care plan completed were not taken onto the caseload via a DIR again (93.3%) between April and December 07. Of the 194 clients who had a care plan completed, 13 re-presented at least once (4.6%) and four twice (2.1%).
5.4 Transfers from Prison 5.4 Transfers from Prison
Table S16 - Fre ble S16 - Frequen quency of re cy of re-pre
sentation of clients who
- f clients who had a succe
d a successful ssful tran transfe sfer completed completed Re-pre Re-presentation sentation Fre Frequen quency (n=1 cy (n=102) 02) Nev Never r 95 (93.1%) Onc Once 6 (5.9%) 2 ti 2 times mes 1 (1.0%) The majority of clients who had a successful transfer completed did not re-present (93.1%) during the time period. There were seven clients who re-presented via a prison transfer at least once (5.9%) between April and December 07, with only one client re- presenting more than once (1.0%).
SLIDE 39 Centre for Public Health, Faculty of Health and Applied Social Sciences, Liverpool John Moores University, Castle House, North Street, Liverpool, L3 2AY Tel: 0151 231 4544
31
5.5 Sefton Summary 5.5 Sefton Summary
Drug Testing Data
- Of the 1168 clients who had a successful drug test completed, 380 (32.5%) had
at least one more drug test between April and December 07.
- Re-presenting clients were more likely to be female compared to clients who did
not re-present.
- Clients who re-presented were older than clients who did not re-present. There
was a greater proportion of under 25 year olds in the non re-presenting group than in the re-presenting group.
- Clients who re-presented were more likely to have committed theft and burglary
than those who did not re-present. In contrast, clients who re-presented were less likely to have committed MDA offences than their non re-presenting counterparts.
- Clients who re-presented were more likely to test positive than clients who did
not re-present. Re-presenting clients were more likely to test positive for both
- piates and cocaine combined than clients who did not re-present.
Assessments (DIRs)
- Of the 473 clients who had an assessment completed, 56 clients re-presented
between April and December 07.
- Re-presenting clients were more likely to be female compared to those who did
not re-present.
- Re-presenting clients were older than clients who did not re-present.
- Clients who re-presented were more likely to have committed shoplifting than
clients who did not re-present. Moreover, these re-presenting clients were less likely to have committed MDA and burglary offences than their non re-presenting counterparts.
- Clients who re-presented reported potentially more problematic drug profiles with
greater proportions using heroin and crack. Re-presenting clients were more likely have a history of injecting compared to clients who did not re-present. Rates of cocaine and cannabis use were higher among clients who did not re-present.
- Clients who re-presented were less likely to be in rented or owned
accommodation compared to non re-presenting clients. In contrast, clients who re-presented were more likely to report staying in a hostel at the time of assessment compared to those who did not re-present.
SLIDE 40 Centre for Public Health, Faculty of Health and Applied Social Sciences, Liverpool John Moores University, Castle House, North Street, Liverpool, L3 2AY Tel: 0151 231 4544
32
- Re-presenting clients were more likely to be unemployed at the time of
assessment than their non re-presenting counterparts.
SLIDE 41 Centre for Public Health, Faculty of Health and Applied Social Sciences, Liverpool John Moores University, Castle House, North Street, Liverpool, L3 2AY Tel: 0151 231 4544
33
Fi Fig g 7: 7: St St H Hel elens S ens Suc ucces essful ul Drug Tes ug Tests -
Age ge (Sept eptem ember ber 07 - 07 - D Dec ecem ember ber 07) 07)
5.1 4.0 24.4 19.2 19.2 1.3 32.5 20.9 15.0 11.4 11.0 25.6 10.3
0.0 5.0 10.0 15.0 20.0 25.0 30.0 35.0 under 25 25 - 29 30 - 34 35 - 39 40 - 44 45 - 49 50 and
Age G ge Group up %
Did not re-present (n=545) Re-presented (n=78)
6.0 St Helens 6.0 St Helens
6.1 Drug Testing Data 6.1 Drug Testing Data
Table ST1 ble ST1 – Frequen Frequency o cy of re-pre re-presentation of cli sentation of clients who ents who had a su a succe ccessful sful drug te rug test st completed completed Re-pre Re-presentation sentation Fre Frequen quency (n=6 cy (n=623) 23) Nev Never r 545 (87.5%) Onc Once 60 (9.6%) 2 ti 2 times mes 14 (2.2%) 3 ti 3 times mes 4 (0.6%) Around a tenth of clients (12.5%) who had a drug test completed between September and December 07 re-presented. There were 78 clients who re-presented at least once (9.6%) and a maximum of three times. There were 18 clients (2.8%) who re-presented more than once. Table S ble ST2 T2 – Re-pre – Re-presentation sentation of
clients by gen gender der Di Did not d not re-pre re-present (n=545) sent (n=545) Re-pre Re-presented (n=78) sented (n=78) Fem Female ale 94 (17.2%) 9 (11.5%) Ma Male le 451 (82.8%) 69 (88.5%) Just over one in ten clients (11.5%) who re-presented were female compared to just under a fifth (17.2%) of those who did not re-present.
SLIDE 42 Centre for Public Health, Faculty of Health and Applied Social Sciences, Liverpool John Moores University, Castle House, North Street, Liverpool, L3 2AY Tel: 0151 231 4544
34
Generally clients who re-presented were older than those who did not re-present. A quarter of the clients (25.6%) who re-presented were under 25 years of age, compared to just under a third of those who did not re-present (32.5%). A higher proportion of clients who re-presented were between 30 and 39 years of age (38.4%) compared to those who did not re-present (26.4%). Table S ble ST3 - Re-pre T3 - Re-presentation sentation of
clients by ethnicity ethnicity Di Did not d not re-pre re-present (n=545) sent (n=545) Re-pre Re-presented (n=78) sented (n=78) Whit White e 540 (99.1%) 78 (100%) Other Other 5 (0.9%) The majority of all clients in both groups were white. Table S ble ST4 T4 – Re-pre – Re-presentation sentation of
clients by offen
e Di Did not d not re-pre re-present (n=545) sent (n=545) Re-pre Re-presented (n=78) sented (n=78) Burgla Burglary ry 54 (9.9%) 12 (15.4%) Fraud Fraud 23 (4.2%) 1 (1.3%) Going Equipped Going Equipped 11 (2.0%) 2 (2.6%) Handling stolen Handling stolen go good
s 9 (1.7%) MD MDA of
nces es 144 (26.4%) 6 (7.7%) Non-Trigge Non-Trigger Offen r Offences 14 (2.6%) 2 (2.6%) Robbery Robbery 10 (1.8%) The Theft ft 267 (49.0%) 55 (70.5%) Vehi Vehicle T cle Taking king 13 (2.4%) There was a higher proportion of clients who re-presented (70.5%) who committed theft compared to those who did not re-present (49.0%). Furthermore, a higher proportion of clients who re-presented (15.4%) committed burglary than those who did not re-present (9.9%). The opposite pattern was evident for MDA offences with 26.4% of clients who did not re-present, committing these offences compared to 7.7% of those who re- presented. Table S ble ST5 T5 – Te – Test st Re Result sult Di Did not d not re-pre re-present (n=545) sent (n=545) Re-pre Re-presented (n=78) sented (n=78) Both ( th (Co Cocaine caine and and O Opiate iates) s) 52 (9.5%) 14 (17.9%) Coca Cocaine ine 130 (23.9%) 16 (20.5%) Opia Opiates tes 53 (9.7%) 13 (16.7%) Nega Negativ tive 310 (56.9%) 35 (44.9%) Clients who re-presented were more likely to test positive (55.1%) than those who did not (43.1%). A higher proportion of clients who re-presented tested positive for both cocaine and opiates (17.9%) and opiates only (16.7%) compared to those who did not re- present (9.5% and 9.7% respectively). However, clients who re-presented (20.5%) were less likely to test positive for cocaine than those who did not re-present (23.9%).
SLIDE 43 Centre for Public Health, Faculty of Health and Applied Social Sciences, Liverpool John Moores University, Castle House, North Street, Liverpool, L3 2AY Tel: 0151 231 4544
35
Table S ble ST6 - Fre T6 - Frequen quency of cy of re-pre re-presen sentation o ation of clients clients who who te tested sted po positi sitive ve Re-pre Re-presentation sentation Fre Frequen quency (n=2 cy (n=291) 91) Nev Never r 258 (88.7%) Onc Once 28 (9.6%) 2 ti 2 times mes 4 (1.4%) 3 ti 3 times mes 1 (0.3%) Just over one in ten clients (11.3%) who tested positive re-presented and produced another positive drug test between September and December 07. Of the 33 clients who tested positive, 28 re-presented once (9.6%), with five clients re-presenting more than
SLIDE 44 Centre for Public Health, Faculty of Health and Applied Social Sciences, Liverpool John Moores University, Castle House, North Street, Liverpool, L3 2AY Tel: 0151 231 4544
36
Fi Fig 8: g 8: St St Helens ns A Assessments -
(A (April 0 07 - D
4.6 0.8 31.9 17.0 17.0 14.9 2.1 27.3 18.1 13.5 11.5 24.2 17.0
0.0 5.0 10.0 15.0 20.0 25.0 30.0 35.0 under 25 25 - 29 30 - 34 35 - 39 40 - 44 45 - 49 50 and
Age G ge Group
%
Did not re-present (n=260) Re-presented (n=47)
6.2 Assessments (DIRs) 6.2 Assessments (DIRs)
Table S ble ST7 - Fre T7 - Frequen quency of cy of re-pre re-presen sentation o ation of clients clients who who h had d an an asse assessment completed sment completed Re-pre Re-presentation sentation Fre Frequen quency (n=3 cy (n=307) 07) Nev Never r 260 (84.7%) Onc Once 32 (10.4%) 2 ti 2 times mes 9 (2.9%) 3 ti 3 times mes 5 (1.6%) 4 ti 4 times mes 1 (0.3%) The majority of clients assessed did not re-present (84.7%) between April and December
- 07. Of the 307 clients who were assessed, 47 re-presented. There were 32 clients
(10.4%) who re-presented once between April and December 07, with a further 15 clients re-presenting more than once. Table S ble ST8 - Re-pre T8 - Re-presentation sentation of
clients by gen gender der Di Did not d not re-pre re-present (n=260) sent (n=260) Re-pre Re-presented (n=47) sented (n=47) Fem Female ale 36 (13.8%) 8 (17.0%) Ma Male le 224 (86.2%) 39 (83.0%) Just under a fifth of clients who re-presented were female (17.0%) compared to just over an eighth of those who did not re-present (13.8%). Around a fifth of clients who re-presented (17.0%) were under 25 compared to just over a quarter of clients who did not re-present (27.3%). However, just under a third of assessed clients who re-presented were between 25 and 29 (31.9%) compared to a quarter of those who did not represent (24.2%).
SLIDE 45 Centre for Public Health, Faculty of Health and Applied Social Sciences, Liverpool John Moores University, Castle House, North Street, Liverpool, L3 2AY Tel: 0151 231 4544
37
Table S ble ST9 - Re-pre T9 - Re-presentation sentation of
clients by ethnicity ethnicity Di Did not d not re-pre re-present (n=258)* sent (n=258)* Re-pre Re-presented (n=47) sented (n=47) Black Black 1 (0.4%) Whit White e 256 (99.2%) 47 (100%) Other Other 1 (0.4%)
*Two clients who did not re-present did not provide information regarding their ethnicity.
The majority of all assessed clients were white. Table S ble ST10 – Re-pre T10 – Re-presentation sentation of
clients by offence
Di Did not d not re-pre re-present (n=259)* sent (n=259)* Re-pre e-presented (n=46)** ented (n=46)** Begging Begging 1 (0.4%) Brea Breach ch 15 (5.8%) 13 (28.3%) Burgla Burglary ry 28 (10.8%) 1 (2.2%) Criminal Dam Criminal Damage ge 2 (0.8%) 1 (2.2%) Fraud Fraud 3 (1.2%) 1 (2.2%) Handling Handling 7 (2.7%) 1 (2.2%) MD MDA O Off ffences es 89 (34.4%) 6 (13.0%) Mo Motoring Offen toring Offences 4 (1.5%) 1 (2.2%) Po Posse ssession sion of Offen
e Weapon apon 1 (0.4%) Publi Public Orde Order Offence r Offence 4 (1.5%) Robbery Robbery 5 (1.9%) 3 (6.5%) Sho Shoplifting plifting 64 (24.7%) 24 (52.2%) The Theft ft 30 (11.6%) 5 (10.9%) The Theft - ft - Car Car 13 (5.0%) 1 (2.2%) War Warrant t 5 (1.9%) 1 (2.2%) Wounding or Wounding or Assaul Assault 7 (2.7%) 2 (4.3%) Other Other 8 (3.1%) 1 (2.2%)
*Three clients who did not re-present did not provide information regarding their offence. **Four clients who re-presented did not provide information regarding their offence.
Clients who re-presented were more likely to have committed shoplifting (52.2%) and breach offences (28.3%) than clients who did not re-present (24.7% and 5.8% respectively). Considerably lower proportions of re-presenting clients had committed MDA and burglary offences (13.0% and 2.2%) than clients who did not re-present (34.4% and 10.8% respectively).
SLIDE 46 Centre for Public Health, Faculty of Health and Applied Social Sciences, Liverpool John Moores University, Castle House, North Street, Liverpool, L3 2AY Tel: 0151 231 4544
38
Table S ble ST11 – T11 – Drug u Drug use in p e in past st month (n=288) month (n=288) †
†
Di Did not d not re-pre re-present (n=244)* sent (n=244)* Re-pre Re-presented (n=44)** sented (n=44)** Amphetamine Amphetamine 12 (4.9%) 2 (4.5%) Benzodi Benzodiazepine azepine 16 (6.6%) 8 (18.2%) Ca Canna nnabis is 48 (19.7%) 5 (11.4%) Coca Cocaine ine 125 (51.2%) 12 (27.3%) Cra Crack ck 84 (34.4%) 31 (70.5%) Ecs Ecstasy asy 5 (2.0%) 1 (2.3%) Heroin Heroin 127 (52.0%) 40 (90.9%) Me Meth thadone adone 17 (7.0%) 5 (11.4%) Other Drug Other Drug 1 (0.4%) 2 (4.5%)
† Proportions of drug use will not add up to 100% as clients can identify use of more than one drug at assessment. *16 clients who did not re-present were removed from analysis as they did not use drugs in last month before assessment **Three clients who re-presented were removed from analysis as they did not use drugs in last month before assessment.
There was a greater proportion of heroin use among clients who re-presented (90.9%) than those who did not (52.0%). Higher proportions of clients who re- presented, used crack (70.5%) and benzodiazepines (18.2%), than those who did not re-present (34.4% and 6.6% respectively). Moreover, clients who re-presented were more likely to use illicit methadone (11.4%) than those who did not re-present (7.0%). Lower proportions of clients who re-presented reported using cannabis (11.4%) and cocaine (27.3%) compared to those who did not re-present (19.7% and 51.2% respectively). Table S ble ST12 - Life T12 - Lifetime inje time injecting cting (n=288) (n=288) Di Did not d not re-pre re-present (n=244)* sent (n=244)* Re-pre Re-presented (n=44)** sented (n=44)** 79 (32.4%) 28 (63.6%)
*16 clients who did not re-present were removed from analysis as they did not use drugs in last month before assessment **Three clients who re-presented were removed from analysis as they did not use drugs in last month before assessment.
Just under two-thirds of clients who re-presented (63.6%) indicated that they had injected in their lifetime compared to just under a third (32.4%) of those who did re- present.
SLIDE 47 Centre for Public Health, Faculty of Health and Applied Social Sciences, Liverpool John Moores University, Castle House, North Street, Liverpool, L3 2AY Tel: 0151 231 4544
39
Table S ble ST13 – Re-pre T13 – Re-presentation sentation of
clients by accommo accommodation dation Di Did not d not re-pre re-present (n=256)* sent (n=256)* Re-pre Re-presented (n=46)** sented (n=46)** Hos Hostel el 19 (7.4%) 7 (15.2%) Rented Rented 131 (51.2%) 26 (56.5%) Own pro Own property perty 33 (12.9%) 1 (2.2%) Se Settled with ttled with Frie Friend nds s 3 (1.2%) 2 (4.3%) Sleep Sleep on diffe
rent friend's floo floor e r every night ery night 13 (5.1%) 1 (2.2%) Staying with Staying with friend friends/famil s/family as a short a short term terms s guest 24 (9.4%) 7 (15.2%) Other Other 33 (12.9%) 2 (4.3%)
*Four clients who did not re-present did not provide information regarding their accommodation. **One client who re-presented did not provide information regarding their accommodation.
The most common type of accommodation reported across both groups was rented accommodation (51.2% did not re-present, 56.5% re-presented). Larger proportions
- f clients who re-presented were living in a hostel (15.2%), staying with friends or
family as a short term guest (15.2%) or settled with friends (4.3%) compared to those who did not re-present (7.4%, 9.4% and 1.2% respectively). Table S ble ST14 – Re-pre T14 – Re-presentation sentation of
clients by emplo employmen ment Di Did not d not re-pre re-present (n=255)* sent (n=255)* Re-pre e-presented (n=45)** ented (n=45)** Economically inacti Economically inactive ve 12 (4.7%) 2 (4.4%) Pupil/student Pupil/student 4 (1.6%) Regul Regular Emplo ar Employmen ment 69 (27.1%) 3 (6.7%) Unemplo Unemployment ment 158 (62.0%) 40 (88.9%) Other Other 12 (4.7%)
*Five clients who did not re-present did not provide information regarding their employment status. **Two clients who re-presented did not provide information regarding their employment status.
The majority of clients in both groups were unemployed but this was more likely to be the case for those who re-presented than for those who did not (88.9% compared to 62.0%). Conversely, the opposite was true for regular employment with 27.1% of clients who did not re-present in regular employment compared to 6.7% of those who re-presented.
SLIDE 48 Centre for Public Health, Faculty of Health and Applied Social Sciences, Liverpool John Moores University, Castle House, North Street, Liverpool, L3 2AY Tel: 0151 231 4544
40
6.3 Care Plans 6.3 Care Plans
Table S ble ST15 - Frequen T15 - Frequency of cy of re-pre re-presentation sentation of
clients who who h had d a a care pl care plan completed an completed Re-pre Re-presentation sentation Fre Frequen quency (n=1 cy (n=103) 03) Nev Never r 97 (94.2%) Onc Once 3 (2.9%) 2 ti 2 times mes 3 (2.9%) The majority of clients who had a care plan completed did not re-present (94.2%). There were a total of six clients who had a care plan completed who subsequently re-presented and had another care plan between April and December 07.
6.4 Transfers from Prison 6.4 Transfers from Prison
Table ST ble ST16 16 - Freq Frequen uency of re-pre cy of re-presentatio sentation of n of cli clients who had a su ents who had a succe ccessful sful transfer transfer completed completed Re-pre Re-presentation sentation Fre Frequen quency (n=4 cy (n=48) 8) Nev Never r 46 (95.8%) Onc Once 2 (4.2%) The majority of clients who had a successful transfer completed did not re-present (95.8%). Only two clients who had a successful transfer completed re-presented again via this route between April and December 07.
SLIDE 49 Centre for Public Health, Faculty of Health and Applied Social Sciences, Liverpool John Moores University, Castle House, North Street, Liverpool, L3 2AY Tel: 0151 231 4544
41
6.5 St Helens Summary 6.5 St Helens Summary
Drug Testing Data
- Of the 623 clients who had a successful drug test completed, 78 (12.5%) had
at least one more drug test completed between September and December 07.
- Clients who re-presented were generally older than those who did not re-
present.
- Clients who re-presented had more commonly committed theft and burglary
than to clients who did not re-present.
- Clients who re-presented were more likely to test positive than clients who
did not re-present. Clients who re-presented tested positive for opiates and cocaine combined more often than clients who did not re-present. Assessments (DIRs)
- Of the 307 clients who were assessed, 47 (15.3%) had more than one
assessment completed between April and December 07.
- Clients who re-presented were more likely to be female compared to those
who did not re-present.
- Re-presenting clients were generally older than their non re-presenting
- counterparts. A lower proportion of clients who re-presented were under 25,
than those who did not re-present.
- Clients who re-presented were more likely to have committed breach and
shoplifting offences, and less likely to have committed burglary and MDA
- ffences than clients who did not re-present.
- Clients who re-presented reported potentially more problematic drug using
profiles with greater proportions using heroin, crack and amphetamines and a much greater proportion having a history of injecting behaviour. In contrast, rates of use of cocaine and cannabis were lower among clients who re- presented compared to those who did not re-present.
- Clients who re-presented were more likely to be in rented accommodation
than clients who did not re-present. Clients who did not re-present were less likely to report that they were living in a hostel and staying with friends or family as a short term guest than clients who re-presented.
- Clients who re-presented were more likely to be unemployed than clients
who did not re-present.
SLIDE 50 Centre for Public Health, Faculty of Health and Applied Social Sciences, Liverpool John Moores University, Castle House, North Street, Liverpool, L3 2AY Tel: 0151 231 4544
42
7.0 Wirral 7.0 Wirral
7.1 Drug Testing Data 7.1 Drug Testing Data
Table ble W1 W1 -
Frequency cy of re-pre
sentation of clients clients who who were were su succe ccessfull sfully d drug ug te test sted ed Re-pre Re-presentation sentation Fre Frequen quency (n=1 cy (n=1672) 672) Nev Never r 1414 (84.6%) Onc Once 166 (9.9%) 2 ti 2 times mes 53 (3.2%) 3 ti 3 times mes 15 (0.9%) 4 ti 4 times mes 12 (0.7%) 5 ti 5 times mes 7 (0.4%) 6 ti 6 times mes 1 (0.1%) 7 ti 7 times mes 2 (0.1%) 8 ti 8 times mes 2 (0.1%) The majority of clients who had a successful drug test completed did not re-present (84.6%). Of the 1672 clients who were drug tested, 258 clients re-presented at least
- nce between April and December 07. There were 53 clients who re-presented
twice during the analysed time period (3.2%). There were an additional 12 clients who re-presented more than four times during the time period, with a maximum re- presentation of eight times during nine months. Table W2 – ble W2 – Re-pre Re-presentation of clients sentation of clients by gen gender der Di Did not d not re-pre re-present (n=1414) sent (n=1414) Re-pre Re-presented (n=258) sented (n=258) Fem Female ale 327 (23.1%) 44 (17.1%) Ma Male le 1087 (76.9%) 214 (82.9%) Just under a fifth of clients who re-presented (17.1%) between April and December 07 were female compared to 23.1% of clients who did not re-present.
SLIDE 51 Centre for Public Health, Faculty of Health and Applied Social Sciences, Liverpool John Moores University, Castle House, North Street, Liverpool, L3 2AY Tel: 0151 231 4544
43
Fi Fig 9 g 9: Wi Wirral S Successf ccessful ul D Drug Te Test sts - A Age (A (April 0 07 - D
34.2 6.0 5.1 15.9 4.3 3.5 11.0 12.2 14.4 17.0 10.5 17.1 14.7 34.1
0.0 5.0 10.0 15.0 20.0 25.0 30.0 35.0 40.0 under 25 25 - 29 30 - 34 35 - 39 40 - 44 45 - 49 50 and
Age G ge Group
%
Did not re-present (n=1414) Re-presented (n=258)
The age profile of each client group was similar. A slightly higher proportion of clients who re-presented (17.1%) were aged 35 to 39 than those who did not re- present (12.2%). Table W3 – ble W3 – Re-pre Re-presentation of clients sentation of clients by ethnicity ethnicity Di Did not d not re-pre re-present (n=1404)* sent (n=1404)* Re-pre Re-presented (n=257)** sented (n=257)** Black Black 2 (0.1%) Whit White e 1384 (98.6%) 256 (99.6%) Other Other 18 (1.3%) 1 (0.4%)
*Ten clients who did not re-present did not provide information regarding their ethnicity. **One client who re-presented did not provide information regarding their ethnicity.
The majority of clients in both groups were white. Table ble W4 - Re-pre W4 - Re-presentation sentation of
clients by offen
e Di Did not d not re-pre re-present (n=1414) sent (n=1414) Re-pre Re-presented (n=258) sented (n=258) Begging Begging 5 (0.4%) 2 (0.8%) Burgla Burglary ry 158 (11.2%) 38 (14.7%) De Deception ception 24 (1.7%) 2 (0.8%) Fraud Fraud 13 (0.9%) 2 (0.8%) Going equipped Going equipped 11 (0.8%) 7 (2.7%) Handling stolen Handling stolen go good
s 21 (1.5%) MD MDA of
nces es 317 (22.4%) 30 (11.6%) Non-Trigge Non-Trigger Offen r Offences 79 (5.6%) 11 (4.3%) Robbery Robbery 28 (2.0%) 3 (1.2%) The Theft ft 730 (51.6%) 158 (61.2%) Vehi Vehicle T cle Taking king 28 (2.0%) 5 (1.9%)
SLIDE 52 Centre for Public Health, Faculty of Health and Applied Social Sciences, Liverpool John Moores University, Castle House, North Street, Liverpool, L3 2AY Tel: 0151 231 4544
44
A higher proportion of clients who re-presented had committed theft (61.2%) than those who did not re-present (51.6%). Furthermore, clients who re-presented had slightly higher proportions of burglary offences compared to those who did not re-
- present. A lower proportion of clients who re-presented (11.6%) had been arrested
for MDA offences compared to those who did not re-present (22.4%). Table W5 – ble W5 – Te Test Re st Result sult Di Did not d not re-pre re-present (n=1414) sent (n=1414) Re-pre Re-presented (n=258) sented (n=258) Both ( th (Co Cocaine caine and and O Opiate iates) s) 161 (11.4%) 65 (25.2%) Coca Cocaine ine 292 (20.7%) 55 (21.3%) Opia Opiates tes 70 (5.0%) 24 (9.3%) Nega Negativ tive 891 (63.0%) 114 (44.2%) Clients who re-presented were more likely to test positive than those who did not. A higher proportion of clients who re-presented tested positive for both cocaine and
- piates (25.2%) than those who did not re-present (11.4%). The same was true for
clients who tested positive for opiates only (9.3% re-presented, 5.0% did not re- present). Table ble W6 - Fre W6 - Frequen quency of cy of re-pre re-presen sentation o ation of clients clients who who te tested sted po positi sitive ve Re-pre Re-presentation sentation Fre Frequen quency (n=6 cy (n=697) 97) Nev Never r 578 (82.9%) Onc Once 73 (10.5%) 2 ti 2 times mes 24 (3.4%) 3 ti 3 times mes 8 (1.1%) 4 ti 4 times mes 7 (1.0%) 5 ti 5 times mes 5 (0.7%) 6 ti 6 times mes 1 (0.1%) 8 ti 8 times mes 1 (0.1%) The majority of clients who tested positive did not re-present (82.9%). The rates of re-presentation for clients who tested positive ranged from once to a maximum of eight times between April and December 07. Of the 119 clients who tested positive and re-presented, 73 clients re-presented once (10.5%) and 24 clients re-presented twice (3.4%). There were 22 clients who re-presented three of more times during the time period. .
SLIDE 53 Centre for Public Health, Faculty of Health and Applied Social Sciences, Liverpool John Moores University, Castle House, North Street, Liverpool, L3 2AY Tel: 0151 231 4544
45
Fi Fig g 10: 0: W Wirral A Asses essment ents - A Age ge (April 07 - 07 - D Dec ecem ember ber 07) 07)
14.1 1.4 18.8 16.7 20.8 4.2 17.1 12.9 18.4 32.5 3.5 12.5 27.1
0.0 5.0 10.0 15.0 20.0 25.0 30.0 35.0 under 25 25 - 29 30 - 34 35 - 39 40 - 44 45 - 49 50 and over
Age G e Grou
%
Did not re-present (n=510) Re-presented (n=48)
7.2 Assessments (DIRs) 7.2 Assessments (DIRs)
Table W7 ble W7 -
Frequen quency cy of re-pre
sentation ation of clients who clients who had an asse d an assessment sment completed completed Re-pre Re-presentation sentation Fre Frequen quency (n=5 cy (n=558) 58) Nev Never r 510 (91.4%) Onc Once 43 (7.7%) 2 ti 2 times mes 4 (0.7%) 3 ti 3 times mes 1 (0.2%) The majority of assessed clients did not re-present (91.4%). Of the 48 clients who re-presented, 43 (7.7%) re-presented once during the time period. A further five clients (0.9%) re-presented more than once with a maximum of three times. Table ble W8 - Re-pre W8 - Re-presentation sentation of
clients by gen gender der Di Did not d not re-pre re-present (n=510) sent (n=510) Re-pre Re-presented (n=48) sented (n=48) Fem Female ale 76 (14.9%) 7 (14.6%) Ma Male le 434 (85.1%) 41 (85.4%) A similar proportion of clients in both groups were female (14.9% did not re-present and 14.6% re-presented). Clients who re-presented were slightly older than those who did not. Just over a quarter of assessed clients (27.1%) who re-presented were under 25, compared to just under a third of clients who did not re-present (32.5%). There was a higher proportion of clients who re-presented (37.5%) who were between 30 and 39 years
- f age compared to those who did not re-present (30.0%).
SLIDE 54 Centre for Public Health, Faculty of Health and Applied Social Sciences, Liverpool John Moores University, Castle House, North Street, Liverpool, L3 2AY Tel: 0151 231 4544
46
Table ble W9 - Re-pre W9 - Re-presentation sentation of
clients by ethnicity ethnicity Di Did not d not re-pre re-present (n=510) sent (n=510) Re-pre Re-presented (n=48) sented (n=48) Black Black 4 (0.8%) Whit White e 500 (98.0%) 47 (97.9%) Other Other 6 (1.2%) 1 (2.1%) The majority of clients in both groups were white. Table W10 – Re-pre ble W10 – Re-presen sentation ation of clients clients by offence
Di Did not d not re-pre re-present (n=506)* sent (n=506)* Re-pre e-presented (n=48) ented (n=48) Begging Begging 2 (0.4%) Brea Breach ch 2 (0.4%) 2 (4.2%) Burgla Burglary ry 52 (10.3%) 4 (8.3%) Criminal Dam Criminal Damage ge 4 (0.8%) 1 (2.1%) Fraud Fraud 6 (1.2%) Handling Handling 5 (1.0%) MD MDA O Off ffences es 215 (42.5%) 18 (37.5%) Mo Motoring Offen toring Offences 13 (2.6%) 1 (2.1%) Po Posse ssession sion of Offen
e Weapon apon 2 (0.4%) Publi Public Orde Order Offence r Offence 16 (3.2%) 1 (2.1%) Robbery Robbery 9 (1.8%) Sho Shoplifting plifting 76 (15.0%) 13 (27.1%) The Theft ft 56 (11.1%) 5 (10.4%) The Theft - ft - Car Car 43 (8.5%) 5 (10.4%) War Warrant t 1 (0.2%) Wounding or Wounding or Assaul Assault 24 (4.7%) 3 (6.3%) Other Other 9 (1.8%)
*Four clients who did not re-present did not provide information regarding their offence.
A higher proportion of re-presenting clients had committed shoplifting (27.1%) than those who did not re-present (15.0%). A lower proportion of clients who re- presented had committed burglary (8.3%) and MDA offences (37.5%) compared to clients who did not re-present (10.3% and 42.5% respectively).
SLIDE 55 Centre for Public Health, Faculty of Health and Applied Social Sciences, Liverpool John Moores University, Castle House, North Street, Liverpool, L3 2AY Tel: 0151 231 4544
47
Table ble W11 - W11 - Drug u Drug use in in p past m st month (n
=545) †
†
Di Did not d not re-pre re-present (n=497)* sent (n=497)* Re-pre e-presented (n=48) ented (n=48) Amphetamine Amphetamine 20 (4.0%) 2 (4.2%) Benzodi Benzodiazepine azepine 23 (4.6%) 2 (4.2%) Ca Canna nnabis is 172 (34.6%) 11 (22.9%) Coca Cocaine ine 287 (57.7%) 28 (58.3%) Cra Crack ck 174 (35.0%) 16 (33.3%) Ecs Ecstasy asy 20 (4.0%) Heroin Heroin 198 (39.8%) 21 (43.8%) Me Meth thadone adone 38 (7.6%) 4 (8.3%) Other Drug Other Drug 12 (2.4%) 1 (2.1%)
† Proportions of drug use will not add up to 100% as clients can identify use of more than one drug at assessment. *13 clients who did not re-present were removed from analysis as they did not use drugs in last month before assessment.
The drug use profile of the two groups of clients was similar. Nevertheless, a higher proportion of clients who re-presented reported using heroin in the month prior to assessment (43.8%) compared to those who did not re-present (39.8%). Levels of cocaine use were high in both groups. Just under three fifths of re-presented clients reported cocaine use (58.3%) at their assessment compared to 57.7% of clients who did not re-present. Lower proportions of re-presenting clients reported using crack (33.3%) and cannabis (22.9%) than among those who did not re-present (35.0% and 34.6% respectively). Table ble W12 - Life W12 - Lifetime inje time injecting cting (n=545) (n=545) Di Did not d not re-pre re-present (n=497)* sent (n=497)* Re-pre Re-presented (n=48) sented (n=48) 131 (26.4%) 12 (25.0%)
*13 clients who did not re-present were removed from analysis as they did not use drugs in last month before assessment.
A similar proportion of clients in both groups indicated having injected in their lifetime. Table W13 – Re-pre ble W13 – Re-presen sentation ation of clients clients by accommo accommodation dation Di Did not d not re-pre re-present (n=509)* sent (n=509)* Re-pre Re-presented (n=48) sented (n=48) Hos Hostel el 11 (2.2%) Rented Rented 247 (48.5%) 26 (54.2%) Own pro Own property perty 64 (12.6%) 8 (16.7%) Se Settled with ttled with Frie Friend nds s 6 (1.2%) Sleep Sleep on diffe
rent friend's floo floor e r every night ery night 8 (1.6%) 7 (14.6%) Staying with Staying with friend friends/famil s/family as a short a short term terms s guest 2 (0.4%) Other Other 88 (17.3%) 7 (14.6%)
*One client who did not re-present did not provide information regarding their accommodation.
SLIDE 56 Centre for Public Health, Faculty of Health and Applied Social Sciences, Liverpool John Moores University, Castle House, North Street, Liverpool, L3 2AY Tel: 0151 231 4544
48
Rented housing was the most common type of client accommodation across both
- groups. Clients who re-presented were more likely to reside in rented
accommodation (54.2%) than those who did not re-present (48.5%). The same pattern was found for owned accommodation (16.7% re-presented and 12.6% did not re-present). Table W14 – Re-pre ble W14 – Re-presen sentation ation of clients clients by emplo employmen ment Di Did not d not re-pre re-present (n=508)* sent (n=508)* Re-pre e-presented (n=47)** ented (n=47)** Economically inacti Economically inactive ve 166 (32.7%) 9 (19.1%) Pupil/student Pupil/student 5 (1.0%) Regul Regular Emplo ar Employmen ment 153 (30.1%) 15 (31.9%) Unemplo Unemployment ment 179 (35.2%) 22 (46.8%) Other Other 5 (1.0%) 1 (2.1%)
*Two clients who did not re-present did not provide information regarding their employment status. **One client who re-presented did not provide information regarding their employment status.
A lower proportion of clients who re-presented (19.1%) were economically inactive compared to those who did not re-present (32.7%). Just under half of assessed clients who re-presented (46.8%) were unemployed at the time of assessment compared to around a third of those who did not re-present (35.2%). Similar proportions of clients in both groups were in regular employment (30.1% did not re- present and 31.9% re-presented).
SLIDE 57 Centre for Public Health, Faculty of Health and Applied Social Sciences, Liverpool John Moores University, Castle House, North Street, Liverpool, L3 2AY Tel: 0151 231 4544
49
7.3 Care Plans 7.3 Care Plans
Table W15 – ble W15 – Frequen Frequency cy of re-pre
sentation of
clients who had a care d a care pl plan an completed completed Re-pre Re-presentation sentation Fre Frequen quency (n=2 cy (n=222) 22) Nev Never r 218 (98.2%) Onc Once 3 (1.4%) 2 ti 2 times mes 1 (0.5%) The majority of clients who had a care plan completed did not re-present (98.2%) between April and December 07. Of the four clients who had a care plan completed more than once in the period three clients re-presented once (1.4%). One client re- presented more than once (0.5%).
7.4 Transfers from Prison 7.4 Transfers from Prison
Table ble W16 – Frequen W16 – Frequency o cy of re-p re-pre resentatio sentation of n of clients wh clients who
had a succe ccessful tran sful transfer sfer completed completed Re-pre Re-presentation sentation Fre Frequen quency (n=8 cy (n=82) 2) Nev Never r 81 (98.8%) Onc Once 1 (1.2%) The majority of clients who had a successful transfer completed did not re-present (98.8%). Only one client re-presented via this route (1.2%) between April and December 07.
SLIDE 58 Centre for Public Health, Faculty of Health and Applied Social Sciences, Liverpool John Moores University, Castle House, North Street, Liverpool, L3 2AY Tel: 0151 231 4544
50
7.6 Wirral Summary 7.6 Wirral Summary
Drug Testing Data
- Of the 1672 clients who had a successful drug test completed, 258 (15.4%)
re-presented between April and December 07.
- The age profiles of both groups were similar.
- Clients who re-presented were more likely than those who did not to commit
burglary and theft but less likely to have been arrested for MDA offences.
- Clients who re-presented were more likely to test positive than their non re-
presenting counterparts. Clients who re-presented were more likely to test positive for opiates and cocaine combined compared to those who did not re- present. Assessments (DIRs)
- Of the 558 clients who were assessed, 48 (8.6%) re-presented between
April and December 07.
- Clients who re-presented were slightly less likely to be female than their non-
re-presenting counterparts.
- Re-presenting clients were slightly older compared to those who did not re-
present.
- Clients who re-presented were more likely to have committed shoplifting and
less likely to have committed burglary and MDA offences than those who did not re-present.
- The drug use profiles across client groups were similar. Clients who re-
presented reported a slightly more problematic drug use profile with greater proportions using heroin. In contrast, rates of cannabis use were much higher among clients who did not re-present.
- A slightly lower proportion of clients who re-presented had a history of
injecting behaviour compared to those who did not re-present.
- Clients who re-presented were more likely to be living in rented or owned
property than those who did not re-present.
- Re-presenting clients reported higher rates of unemployment than clients
who did not re-present.
SLIDE 59 Centre for Public Health, Faculty of Health and Applied Social Sciences, Liverpool John Moores University, Castle House, North Street, Liverpool, L3 2AY Tel: 0151 231 4544
51
8.0 Merseyside Comparison 8.0 Merseyside Comparison
8.1 Drug Testing Data 8.1 Drug Testing Data
This section will compare and contrast re-presentation rates from drug testing data from April to December 07 for Liverpool, Sefton and Wirral, and from September to December 07 for Knowsley and St Helens D(A)ATs. DIRs will be examined in the same manner across all Merseyside D(A)ATs between April and December 07. Table ble M1 – 1 – Re-pre Re-presentation of clients who sentation of clients who had a su d a succe ccessful sful dru drug g te test completed st completed -
Merseyside comp rseyside compari arison (n=
7034) Me Merseyside D(A)AT rseyside D(A)AT are area Di Did not d not re-pre re-present sent Re-pre Re-presented sented Knows
ey ( (n=384 84) ) 368 (95.8%) 16 (4.2%) Li Liverpo verpool (n=31
71) 2728 (86.0%) 443 (14.0%) Se Sefton (n fton (n=1168) =1168) 788 (67.5%) 380 (32.5%) St H t Hele lens ns (n (n=623 23) ) 545 (87.5%) 78 (12.5%) Wi Wirral (n=1672) rral (n=1672) 1414 (84.6%) 258 (15.4%) Sefton had the highest rate of re-presentation between April and December 07. Knowsley had the lowest proportion of clients who re-presented, however, it must be noted that Test on Arrest was initiated in Knowsley and St Helens in September, therefore it would be expected that rates of re-presentation would be lower than in the other areas. Despite this St Helens has in four months a fairly similar rate of re- presentation to Liverpool and Wirral in 12 months therefore proportions will be lower than in the other intensive areas. Table M2 ble M2 – – Re-pre Re-presentation of sentation of clients who te clients who tested po sted positi sitive – Me ve – Merseyside comp rseyside compari arison (n= (n=3243) 3243) Me Merseyside D(A)AT rseyside D(A)AT are area Di Did not d not re-pre re-present sent Re-pre Re-presented sented Knows
ey ( (n=169 69) ) 160 (94.7%) 9 (5.3%) Li Liverpo verpool (n=15
15) 1263 (83.4%) 252 (16.6%) Se Sefton (n fton (n=571) =571) 375 (65.7%) 196 (34.3%) St H t Hele lens ns (n (n=291 91) ) 258 (88.7%) 33 (11.3%) Wi Wirral (n=697) rral (n=697) 578 (82.9%) 119 (17.1%) Sefton had a much higher proportion of clients who tested positive who went on to test positive again, than the other Merseyside D(A)ATs. This suggests that Sefton had a considerable proportion of clients committing acquisitive crime more than
SLIDE 60 Centre for Public Health, Faculty of Health and Applied Social Sciences, Liverpool John Moores University, Castle House, North Street, Liverpool, L3 2AY Tel: 0151 231 4544
52
8.2 Assessments (DIRs) 8.2 Assessments (DIRs)
Table M3 – Re-p ble M3 – Re-pre resentatio sentation of n of clients clients who h who had an d an asse assessment completed ssment completed – – Me Merseyside comp rseyside compari arison (n=
3193) Me Merseyside rseyside D(A)AT are D(A)AT area Di Did d not re-pre not re-present sent Re-pre Re-presented sented Knows
ey ( (n=257 57) 242 (94.2%) 15 (5.8%) Li Liverpo verpool (n=15
98) 1312 (82.1%) 286 (17.9%) Se Sefton (n fton (n=473) =473) 417 (88.2%) 56 (11.8%) St H t Hele lens ns (n (n=307 07) ) 260 (84.7%) 47 (15.3%) Wi Wirral (n=558) rral (n=558) 510 (91.4%) 48 (8.6%) Going by assessments completed, Liverpool DIP had a higher re-presentation rate than the other Merseyside D(A)ATs. Knowsley and Wirral had the lowest rates of re- presentation.
8.3 Transfers from Prison 8.3 Transfers from Prison
Table ble M4 M4 – – Re-p Re-pre resentation sentation of
clients nts wh who had had a a su successful sful tr tran ansfe sfer c complet mpleted ed – Me Merseyside comp rseyside compari arison (n=
541) Me Merseyside D(A)AT rseyside D(A)AT are area Di Did not d not re-pre re-present sent Re-pre Re-presented sented Knows
ey ( (n=53) 3) 48 (90.6%) 5 (9.4%) Liverpoo
l (n=256 56) ) 237 (92.6%) 19 (7.4%) Se Sefton (n fton (n=102) =102) 95 (93.1%) 7 (6.9%) St H t Hele lens ns (n (n=48) 8) 46 (95.8%) 2 (4.2%) Wi Wirr rral (n=82) al (n=82) 81 (98.8%) 1 (1.2%) Very few clients in any area were successfully referred from prison more than once in the nine month period. Knowsley had the highest rate of re-presentation in terms
SLIDE 61 Centre for Public Health, Faculty of Health and Applied Social Sciences, Liverpool John Moores University, Castle House, North Street, Liverpool, L3 2AY Tel: 0151 231 4544
53
9.0 Discussion 9.0 Discussion
The aim of this report was to find out how many and what type of clients were coming back through the criminal justice system and more specifically the Drug Interventions Programme (DIP) after their initial presentation. The characteristics of clients who re-presented were broken down into demographic information such as gender, age, ethnicity, as well as drug use and offence. This discussion will be divided into themes focusing on the trends that emerged across Merseyside. Re-presentation This analysis appears to match previous studies (Beynon, Bellis and McVeigh, 2006) in retention rates in drug treatment, with it demonstrating that clients will re-enter DIP and the criminal justice system. Based on the drug testing data, the proportion
- f clients who re-presented varied across the five Merseyside areas. Sefton in
particular saw a high proportion of clients (32.5%) re-presenting compared to the
- ther areas. Sefton also had the highest proportion of clients who tested positive
and had at least one more positive test during the time period, with Knowsley having the lowest compared to the other Merseyside areas. Recommend Recommendation: ation: Sefton DIP need to ensure that clients testing numerous times within a relatively short period of time are targeted in order to ensure they receive a service that ‘grips’ them and reduces their re-appearance in the criminal justice system. Analysis of assessments from the Drug Interventions Record (DIR) showed that Liverpool DIP had the highest proportion of clients re-presenting into DIP between April and December 07 when compared to the other areas. Knowsley and Wirral DIP had the lowest proportions of re-presentation suggesting either that Knowsley and Wirral have more success at engaging clients thereby preventing re-offending and re-presenting or that the client group is somehow different and less recidivistic. Gender In most areas there were contradictory indications regarding the gender of clients re-
- presenting. In Knowsley, Liverpool and St Helens clients re-presenting through drug
testing were less likely to be female than their counterparts who did not re-present. However, this pattern was reversed when re-presentation through a DIP
SLIDE 62 Centre for Public Health, Faculty of Health and Applied Social Sciences, Liverpool John Moores University, Castle House, North Street, Liverpool, L3 2AY Tel: 0151 231 4544
54
assessment was examined, where re-presenting clients were more likely to be
- female. This may suggest that in these areas females make up a smaller proportion
- f the overall persistent (repeat offending) acquisitive crime committing population.
In contrast, findings would suggest that females may make up a larger proportion of the drug using persistent acquisitive crime committing population. It should always be remembered however, that regardless of this males still make up the majority of clients in both the re-presenting and non re-presenting groups. Recommend Recommendation: ation: All teams should continue to have female clients as a focus for work as findings would suggest they have increased risk of not fully engaging in services and re-offending. Age In most areas, for both data sets the age profile of those re-presenting was older than those who did not. However, the pattern is less prominent among those assessed in St Helens. Drug testing data showed that Wirral had a different age profile pattern compared to the other Merseyside D(A)ATs, with similar proportions seen in both groups. The question is whether areas are engaging better with young people or is it that they are less likely to re-offend. This is possibly attributable to their drug use profile which is verified by Cuddy and Duffy’s (2008) research on comparisons between under and over 25 year old DIP clients. Younger clients were less likely to use the drugs normally associated with problematic use such as heroin and crack and spent less on drugs than their older counterparts. Ethnicity There was little difference in the ethnicity profile of clients who re-presented in all areas from that of the clients who did not re-present, with the majority of clients in both groups being white. Offence According to the drug testing data a very clear pattern was evident. Re-presenting clients were more likely to have committed theft and burglary in every area than those who did not re-present. It is worrying that in every area burglary is one of the most common offences committed among those re-presenting. Burglary is a serious crime and may indicate a client who would be difficult to work with but it is important for teams to try and engage this group as they are clients who can cause
SLIDE 63 Centre for Public Health, Faculty of Health and Applied Social Sciences, Liverpool John Moores University, Castle House, North Street, Liverpool, L3 2AY Tel: 0151 231 4544
55
substantial problems for communities. All teams need to ensure that if clients committing burglary offences are not considered for nomination to the prolific
- ffenders’ scheme, that they are given a higher priority around breaching and
actioning of those breaches. Whilst drug testing data showed that burglary offences were more likely among those who re-presented, DIR data showed burglary offences were higher among non re-presenters. It can be suggested that substantial proportions of clients committing burglary and subsequently tested, are potentially testing negative. Therefore, these clients would not be being picked up by the DIP teams. Recommend Recommendation: ation: Further investigation of this finding is needed around clients committing burglary offences who are testing negative, however, if this assumption is correct there is a need to focus on non drug using burglars who may be repeat
Generally, clients who re-presented were less likely to have committed MDA
- ffences than their non re-presenting counterparts. This pattern was also supported
by DIR data. This trend may be associated with possession of cocaine, showing a different profile and anecdotal evidence of a link to the night time economy. Liverpool had particularly high proportions of re-presenting clients committing begging offences. The higher proportions of begging seen among clients assessed in Liverpool may simply be due to the draw of the city centre if begging is an individuals’ main source of income. In addition, the city centre and its hostel and homelessness support services may attract this group. Begging is a relatively low tariff offence and as such even persistent beggars may not be charged or receive community orders under which drug treatment can be mandated. This may mean that these clients are more difficult to engage in service. Recommend Recommendation: ation: Liverpool need to consider a strategy to address the needs of this group, which will be complex. This may be through enhanced links with homelessness services and accommodation providers. Drug Use Analysis of drug testing data identified higher proportions of re-presenting clients tested positive compared to their non re-presenting counterparts. Similarly, clients from all areas who re-presented were more likely to test positive for both opiates
SLIDE 64 Centre for Public Health, Faculty of Health and Applied Social Sciences, Liverpool John Moores University, Castle House, North Street, Liverpool, L3 2AY Tel: 0151 231 4544
56
and cocaine combined compared to those who did not re-present. In most areas clients who re-presented were less likely to test positive for cocaine only. This supports suggestions in the previous point about a connection with night time economy and potential association with a more recreational drug use pattern. Wirral DIP showed the opposite pattern in that clients who re-presented were more likely to produce positive tests for cocaine alone than those who did not re-present. Wirral’s re-presenting cocaine using clients were also identified in assessment data, with cocaine being the most common drug with both re-presenters and non re- presenters and rates of cocaine use among re-presenters being higher than in any
Recommend Recommendation: ation: Most areas need to continue to focus on ‘traditional’ problematic drug users. The reasons why areas appear to be struggling with this group and why they are not gripping these clients should be investigated. Current services are generally configured to deal with this client group; therefore their re-presentation which is indicative of a failure to fully engage in service is a trend that needs to be
- addressed. The exception to this finding is that Wirral seem to need a more cocaine
related strategy with higher reports of cocaine use compared to the other areas. Injecting Clients who re-presented in most areas were more likely to have injected in the past prior to assessment. Therefore, re-presenting clients are more likely to have associated health problems. This is a key issue as it is very important to engage these clients quickly into DIP to help with health problems through harm reduction advice and referral to appropriate health services such as testing for blood borne
- viruses. Findings suggest that these clients are likely to re-present which implies
drop out from services therefore urgency is required from DIP workers to give the appropriate advice for clients to take away with them and wherever possible, rapid intervention. Accommodation The accommodation status of each group varied across each area. Generally figures suggested less stable accommodation among re-presenting clients. Recommend Recommendation: ation: Particular emphasis from the teams is needed on helping clients not in stable accommodation as they are more likely to drop out of DIP and re- present.
SLIDE 65 Centre for Public Health, Faculty of Health and Applied Social Sciences, Liverpool John Moores University, Castle House, North Street, Liverpool, L3 2AY Tel: 0151 231 4544
57
Employment Analysis showed that re-presenting clients were more likely to be unemployed than those who did not re-present across all Merseyside areas. Wirral DIP had a higher percentage of re-presenting clients who were employed than any other Merseyside area. Care Plans Findings show that in all areas lower proportions of clients who had a care plan completed had another care plan completed during the time period, when compared to rates of assessment re-presentation. It can be argued that clients who are taken
- nto the caseload are ‘gripped’ more fully and therefore do not re-present.
Alternatively, it could also be that when clients come back through they are for some
- ther reason, not taken onto the caseload. It may be that previous experiences put
clients off full engagement the second time around or they may be remanded in custody. Recommend Recommendation: ation: Further work is needed to work out what the difference is in terms of re-presentation and re-offending for those taken onto the caseload and those who are not. Transfers from Prison Multiple successful transfers from prison were rare in all areas. This may be due to the relatively small amount of time investigated in this report. It may be that during this nine month period there was not enough time for multiple prison stays to occur. Recommend Recommendation: ation: Further analysis is needed, to investigate the prevalence of repeat successful transfers for clients over a larger time period.
SLIDE 66 Centre for Public Health, Faculty of Health and Applied Social Sciences, Liverpool John Moores University, Castle House, North Street, Liverpool, L3 2AY Tel: 0151 231 4544
58
10.0 Conclusion 10.0 Conclusion
This report has shown that rates of re-presenting vary and in some cases D(A)ATs may wish to consider this when setting targets for Local Area Agreements (LAA). Some substantial differences were found between re-presenters and non re-
- presenters. Re-presenting clients were generally older, with a more problematic drug
use profile, less stable accommodation, less employment and had committed more serious crime such as theft and burglary offences. This ‘core’ client group are more likely to cause damage to communities and be at risk themselves. By contrast non re-presenters were generally a younger, potentially less problematic group and it is not clear whether teams are better at dealing with these clients or whether they are simply less likely to re-offend and re-present. The latter of these two seems more
- likely. This work only gives an impression of the rate of re-presentation; it does not
truly examine scheme success. A more detailed evaluation of re-offending rates pre and post intervention is needed.
SLIDE 67 Centre for Public Health, Faculty of Health and Applied Social Sciences, Liverpool John Moores University, Castle House, North Street, Liverpool, L3 2AY Tel: 0151 231 4544
59
11.0 References 11.0 References
Bennet & Holloway (2004) Drug use and offending: summary results of the first two years of the NEW-ADAM programme Findings 179, Home Office, London Beynon, C.M., Bellis, M., & McVeigh, J. (2006) Trends in drop out, drug free discharge and rates of re-presentation: a retrospective cohort study of drug treatment clients in the North West of England Bio Med Central Public Health Cunliffe, J. and Shepherd, A. (2007) Re-offending of adults: results from the 2004 cohort Home Office Statistical Bulletin, Home Office, London Dawson, P. (2005) Early Findings from the Prolific and Other Priority Offenders Evaluation, Home Office Development and Practice Report, Home Office: London Home Office (2004) Tackling Drugs. Changing lives: Keeping communities safe from
- drugs. Drug Strategy Progress Report London, Home Office. Available at:
http://www.drugs.gov.uk/publication-search/drug-strategy/changinglives. pdf?view=Binary UKDPC (2008) Reducing Drug Use, Reducing Re-offending. . Are programmes for problem drug-using offenders in the UK supported by the evidence? UK Drug Policy Commission (UKDPC): London Hser, Y., Anglin, D., Grella, C., Longshore, D. & Pendergast, M.L. (1997) Drug treatment careers: a conceptual framework and existing research findings Journal of Substance Abuse Treatment 14, 543-558 Seddon, T. (2000) Explaining the Drug-Crime Link: Theoretical, Policy and Research Issues Journal of Social Policy, 29, 95-107 Skodbo, S., Brown, G., Deacon, S., Cooper, A., Hall, A., Millar, T. Smith, J. & Whitman, K. (2007) The Drug Interventions Programme (DIP): addressing drug use and offending through ‘Tough Choices’ Research Report 2 Key Implications London: Home Office
SLIDE 68
Centre for Public Health, Faculty of Health and Applied Social Sciences, Liverpool John Moores University, Castle House, North Street, Liverpool, L3 2AY Tel: 0151 231 4544
60
Stewart, D., Gossop, M., Marsden, J. and Rolfe, A. (2000) Drug misuse and acquisitive crime among clients recruited to the National Treatment Outcome Research Study (NTORS) Criminal Behaviour and Mental Health, 10, 10-20 The numbers in treatment in the North West – 2006/07 http://www.nta.nhs.uk/media/media_releases/2007_media_releases/numbers_in_tre atment_north_west_191007.aspx (Accessed February 2008)