
SLIDE 1
1
CONSOLIDATION AND PROGRESS IN THE RING OF FIRE Ontario’s emerging Ni-Cu-PGE and Chromite region
NORONT RESOURCES LTD. Q2 2016
CONSOLIDATION AND PROGRESS IN THE RING OF FIRE O ntarios emerging Ni - - PowerPoint PPT Presentation
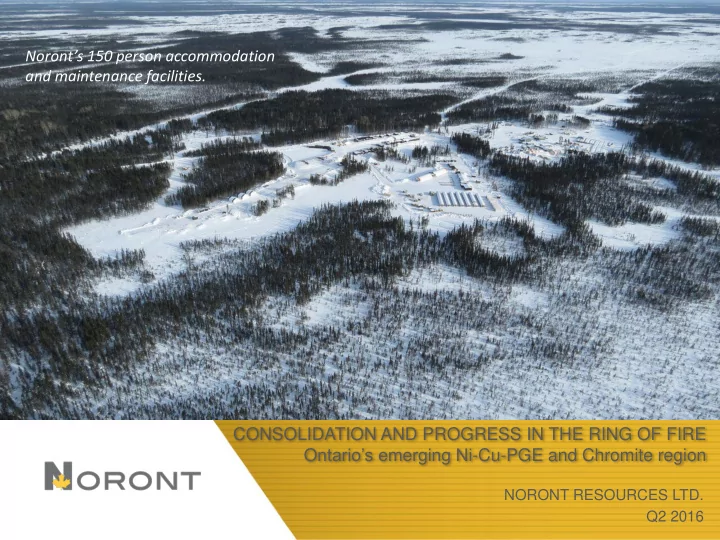
Noronts 150 person accommodation and maintenance facilities. CONSOLIDATION AND PROGRESS IN THE RING OF FIRE O ntarios emerging Ni -Cu-PGE and Chromite region NORONT RESOURCES LTD. Q2 2016 1 CAUTIONARY NOTE REGARDING FORWARD-LOOKING
1
NORONT RESOURCES LTD. Q2 2016
2
This presentation includes certain “forward-looking information” within the meaning of applicable Canadian securities legislation. Examples of such forward-looking information includes information regarding the timing, extent and success of exploration, development and mining activities, conclusions of economic evaluations (including those contained in the Technical Report, as defined herein), project financing requirements, project permitting, planned infrastructure for the Ring of Fire region and the estimated and anticipated economic impact of Noronts mineral projects. Forward-looking information is based on reasonable assumptions that have been made by the Company as at the date of such information and is subject to known and unknown risks, uncertainties and other factors that may cause the actual results, level of activity, performance or achievements of the Company to be materially different from those expressed or implied by such forward-looking information, including but not limited to: the impact of general business and economic conditions; risks related to government and environmental regulation, actual results of current exploration and development activities, changes in project parameters as plans continue to be refined; problems inherent to the marketability of base and precious metals; industry conditions, including fluctuations in the price of base and precious metals, fluctuations in interest rates; government entities interpreting existing tax legislation or enacting new tax legislation in a way which adversely affects the Company; stock market volatility; competition; risk factors disclosed in the Company’s most recent Management’s Discussion and Analysis and Annual Information Form, available electronically on SEDAR; and such other factors described or referred to elsewhere herein, including unanticipated and/or unusual events. Many such factors are beyond Noront’s ability to control or predict. Although the Company has attempted to identify important factors that could cause actual results to differ materially, there may be other factors that cause results not to be as anticipated, estimated or intended. There can be no assurance that forward-looking information will prove to be accurate as actual results and future events could differ materially from those reliant on forward-looking information. All of the forward-looking information given in this presentation is qualified by these cautionary statements and readers are cautioned not to put undue reliance on forward-looking information due to its inherent uncertainty. Noront disclaims any intent or obligation to update any forward-looking information, whether as a result of new information, future events or results or otherwise, except as required by law. This forward-looking information should not be relied upon as representing the Company’s views as of any date subsequent to the date of this presentation. Mineral resources that are not mineral reserves do not have demonstrated economic viability. The estimate of mineral resources may be materially affected by environmental, permitting, legal, title, socio-political, marketing or other relevant issues. Ryan Weston, M.Sc.,MBA, P.Geo, VP, Exploration, Qualified Person as defined by National Instrument 43-101 –Standards of Disclosure for Mineral Projects (“NI-43-101”), has reviewed and approved for the technical information contained in this presentation.
3
(DeBeers) (Goldcorp) (Goldcorp) (New Gold) (North American Palladium) (Barrick) (Glencore) (Goldcorp and Lakeshore) (Alamos) (Vale & Glencore) (Noront)
4
Feasibility Preliminary Economic Analysis Future Options
Au Cr Ni-PGE Cu-Zn Ti-V
Macfadyen
Big Daddy
Black Label
JJJ
Kyle
Blue Jay
Black Thor
McFaulds
Blackbird
Diamond
5
Chairman of the board of Noront Resources, President and CEO of Calico Resources Corporation. President & CEO of Americas Silver, Former SVP, Corporate Development at Barrick Gold Corporation. 40+ years in mine engineering and project management with SNC Lavalin, Inco & BHP Former President and COO for Maple Leaf Sports & Entertainment Managing Director at Resource Capital Funds (RCF). General Manager of Strategy and Planning for Baosteel Resources International. Former SVP, and General Counsel at Barrick Gold Corporation. President & CEO of Noront Resources Ltd. 25+ years of domestic and international experience in mine development and operations with Falconbridge, Noranda and most recently Managing Director, Australasia with Xstrata Nickel. 30 years of experience in all aspects of exploration, feasibility planning, project development, construction, and operations. Former SVP, Projects & Exploration at Glencore/Xstrata. A finance executive with over 15 years in the mining and retail industries. Former VP, Business Development at Harry Winston Diamond Corporation. 15+ years experience in exploration for both base and precious metals internationally. Previously, Ryan served as Senior Geologist with Cliffs Natural Resources and Chief Geologist at Carlisle Goldfields. Paul Parisotto Darren Blasutti Ted Bassett Tom Anselmi Dave Thomas Yuanqing Xu Sybil Veenman Alan Coutts MANAGEMENT BOARD Alan Coutts President & CEO Stephen Flewelling
Chief Development Officer
Greg Rieveley CFO Ryan Weston VP, Government Affairs
6
Overview Listing: TSX V Symbol: NOT June 30, 2016: $0.33 52 Week High: $0.51 52 Week Low: $0.28 Market Cap ~ $93M Shares O/S: ~ 284.3 M Shares F/D: ~ 324.8 M Loan Term Debt1,2: US $40 M Major Shareholders Resource Capital Fund: 20.8% Baosteel: 8 %
1. RCF Loan (secured by parent company): US$15 M convertible @ CDN0.34/share 2. Franco Nevada Loan: US$25 M secured by assets of wholly owned subsidiary
7
Environmental Assessment Impact Benefit Agreement
Infrastructure
Re-evaluating permitting structure; 3 years of baseline studies completed. Progressing IBA evolution process promoting equity
Updating feasibility study and preparing for Project execution. Active discussions with First Nation communities and government on regional infrastructure plan. Strategic analysis of first stage chromite opportunity Advancing Ni, Cu, PGM exploration and developing Cu- Zn and Au programs. Discussions with Banks regarding Project Financing for Eagle’s Nest Project. Evaluating interim financing options.
8
feasibility positive, Eagle's Nest Ni-Cu-PGE Mine with an 11-20 year life.
positioned to become a low cost (first quartile) nickel producer
with paste backfill
underground and provide additional void for tailings.
0 Elev
North – South Section Looking East
200m 700m 1200m 1570m
N S
Production Ramps
Portal Area Esker Camp 2.5km to Airstrip
0 250m 500m
Surface Meters below surface
capex estimate confidence: ‒ Concentrator will be on surface (previously underground) ‒ Simplification of mill flow sheet (1 vs. 2 circuits) ‒ Minimize up-front capital (just-in-time aggregate production) ‒ Acquired Cliff’s 150 person camp to be used for construction housing
1 - Please see the report titled “NI 43-101 Technical Report Feasibility Study McFaulds Lake Property Eagle’s Nest Project James Bay Lowlands Ontario, Canada,” dated October 19, 2012 (with an effective date of September 4, 2012) (the “Technical Report”) for details regarding the anticipated mining methods and life-of-mine of the Eagle's Nest project. A copy of the Technical Reportmay be accessed under Noront’s company profile on SEDAR at www.sedar.com
9
Mineral Reserve & Resource 1 Category T (000) Ni (%) Cu (%) Pt (gpt) Pd (gpt)
Proven and Probable 11,131 1.68 0.87 0.89 3.09 Inferred Resources 8,966 1.10 1.14 1.16 3.49
1. Please see the “Technical Report” for details regarding the mineral reserve estimate above (section 15.1) and the mineral resource estimate above (14.2). Sections 14.2 and 15.1 of the Technical Report include a description of the key assumptions, parameters, and methods used to estimate the mineral resources and mineral reserves
2. Mineral resources are estimated at a cut off grade 0.5% Ni
10
September 2012 Metal Prices December 31, 2015 Long Term (L-T) Consensus Metal Prices Initial Capital (CDN) $ 609 M Sustaining Capital (CDN) $ 160 M C1 Cash Cost (USD /lb Nickel, net of by-products) $ 1.53 $ 0.73 C1 plus Sustaining (USD /lb Nickel, net of by-products) $ 2.04 $ 1.17 Average annual after-tax cash flow (CDN) $ 180 M $ 210 M NPV (after tax) @ 8% (CDN) $ 543 M $ 693 M IRR 28% 32 % Payback 2 years 2 years Average Annual Nickel Production 15 kt
Revenue Contribution September 2012 Prices Revenue Contribution September 30, 2015 Metal Prices
Ni 67% Cu 14% Pt 7% Pd 11% Au 1% Ni 57% Cu 15% Pt 8% Pd 19% Au 1%
Price Assumptions
L-T Prices * Nickel (USD/lb) 9.43 8.50 Copper (USD/lb) 3.6 3.00 Platinum (USD/oz) 1,600 1300 Palladium (USD/oz) 599 925 Forex (USD/CAD) 1.01 1.18
Note: The feasibility results shown above are based on September 2012 metal prices as contained in the report titled “NI 43-101 Technical Report Feasibility Study McFaulds Property Eagle’s Nest Project James Bay Lowlands Ontario, Canada dated October 19, 2012 (with an effective date of September 4th, 2012, a copy of which is available under Noront’s company profile on SEDAR at www.sedar.com.
* Source: Bank of Nova Scotia Long Term Prices as of Dec 31, 2015
11
Source: Bank of Nova Scotia
2015 Global Nickel Industry C1 cash cost + Sustaining Investments, USD per ton of nickel
Eagle’s Nest (projected C1 plus sustaining: US$4,500/t) Eagle’s Nest (projected C1: US$3,400/t)
12
Noront’s Eagle’s Nest Project Independence Group’s Nova Project Lundin’s Eagle Mine
Market Cap/Purchase Price $72 M (USD) $1,340 M (USD)
$6.0 M (USD)
$15 M1 (USD)
$87 M (USD) $1,340 M (USD)
Ontario, Canada Western Australia Michigan, USA Mine Type Underground Underground Underground Current Development Stage Completed Feasibility Permitting/Financing Underway First Concentrate expected Dec 2016 Production, Commissioned Q3 2014 Capex CDN $609 M AUS $ 443 M USD $725M Mine Life (Reserves Only) 11 years 9 years 7 years Mineral Reserves
2.32 % 680 M $ 0.11 2.25 % 718 M $ 1.95 3.55% 482M
(~tonnes per year) 15,500 (21,500 to start) 26,000 17,000 (25,000 to start) Nickel Cash Costs Net of Credits (USD /lb nickel) $1.53 $1.65 $2.00
1 Excludes debt secured by chromite assets 2 Nickel equivalent calculated using Ni =$8.50/lb, Cu= $3.00/lb, Pt= $1590/oz, Pd= $950/oz 3 Based on publicly available information regarding Nova Nickel and Lundin Eagle
13
14
Community Dialogue IBA Negotiations Eagle’s Nest Feasibility Detailed Engineering EIS/EA Permitting Finance Construction Commissioning Production
15
38 74 87 102 180 267 307 493 453 361 115 123 128 153 165 184 199 230 232 228 111 162 123 227 237 261 265 177 281 433 2006 2007 2008 2009 2010 2011 2012 2013 2014 2015 Chinese NPI Production Chinese Refined Nickel Production (ex-NPI) Dependency on imports
Source: WoodMackenzie
Chinese NPI production peaked in 2013, however overall nickel consumption continues to trend higher, resulting in an increased dependency on imports
Chinese Nickel Consumption kt
16
0.2 0.4 0.6 0.8 1 1.2 1.4 1.6 2005 2006 2007 2008 2009 2010 2011 2012 2013
Kg Ni/person Year
Nickel Consumption Intensity
EU/US/Japan China 3% 15% 18% 29% 54% 57% 67% 85%
Platinum Palladium Nickel Copper Iron Ore (62% Fe- eq) Lead Aluminium (Bauxite) Tin Zinc
Chinese Self-Sufficiency
Source: WoodMackenzie
17
CLF) for USD$27.5 M, funded by Franco-Nevada Corp. (NYSE/TSX: FNV)
M of exploration & advancement work
– World-class chromite deposits: Black Thor (100%), Black Label (100%) and Big Daddy (70%) – The McFauld’s Lake Copper-Zinc VMS deposit (85%) – A highly prospective and underexplored land package
– Franco-Nevada supports Noront’s view that the Ring of Fire represents an emerging multi- commodity camp and wanted to participate in the future upside through various royalty interests – Provided Noront with a 5 year, USD $25.0 M loan at a 7% interest rate (to be accrued and paid at the end of the loan term), secured by the acquired assets and non-recourse to parent company – Franco receives a 3% royalty over Black Thor and a 2% royalty over subsequent discoveries – In addition, Franco paid USD $3.5M for a 2% royalty on Noront’s pre-transaction properties, excluding the Eagle’s Nest Ni-Cu-PGE deposit
Fire discoveries to date
18
Blackbird1 Tonnes (millions) Cr2O3 (%) Measured 9.3 37.44 Indicated 11.2 34.36 Measured and Indicated 20.5 35.76 Inferred 23.5 33.14 Black Thor2 Tonnes (millions) Cr2O3 (%) Measured 107.6 32.2 Indicated 30.2 28.9 Measured and Indicated 137.7 31.5 Inferred 26.8 29.3 Black Label2 Tonnes (millions) Cr2O3 (%) Measured
5.4 25.3 Measured and Indicated 5.4 25.3 Inferred 0.9 22.8 Big Daddy2 Tonnes (millions) Cr2O3 (%) Measured 23.3 32.1 Indicated 5.8 30.1 Measured and Indicated 29.1 31.7 Inferred 3.4 28.1
1. Please see the “Technical Report” for details regarding the mineral reserve estimate above (section 15.1) and the mineral resource estimate above (14.2). Sections 14.2 and 15.1 of the Technical Report include a description of the key assumptions, parameters, and methods used to estimate the mineral resources and mineral reserves respectively. A copy of the Technical Report may be accessed under Noront’s company profile on SEDAR at www.sedar.com 2. Please see the report titled “National Instrument 43-101 Technical Report, Black Thor, Black Label and Big Daddy Chromite Deposits, McFaulds Lake Area, Ontario, Canada, Porcupine Mining Division, NTS 43D16, Mineral Resource Estimation Technical Report” dated July 27th, 2015, prepared by Alan Aubut, P.Geo., of the Sibley Basin Group for resource estimates for Black Thor, Black Label and Big Daddy. 3. Blackbird estimated at a cut-off grade of 30% Cr2O3. 4. Black Thor, Black Label and Big Daddy estimated at a cut off grade of 20% Cr2O3
19
20
exposed (no outcrop) with challenging access, so additional discoveries are likely with further exploration
volcanic belt terrain with multiple commodities and deposit types identified to date: Cu-Zn VMS, magmatic Ni-Cu-PGE sulphide, mafic-ultramafic layered intrusion chromite–PGE
Western Australia and South Africa with significant potential for gold and diamond deposits in addition to deposits discovered to date
PGE deposits
21
Mineral Resource Estimate – McFaulds 31 Category Tonnes Cu (%) Zn (%) Measured and Indicated 802,000 3.75 1.1 Mineral Resource Estimate- McFaulds 11 Category Tonnes Cu (%) Zn (%) Inferred 279,000 2.13 0.58
1. Please see the “Updated Technical Report on the McFaulds Lake Project, Porcupine Mining Division, James Bay Lowland, Ontario, Canada” with an effective date August 30th, 2008, prepared by Deep Search Exploration Technologies Inc for details regarding the mineral resource estimate. 2. Mineral resources are estimated at a cut off grade 1.5% Cu.
22
23
24
25
26
27
28