SLIDE 9 12/04/2018 9
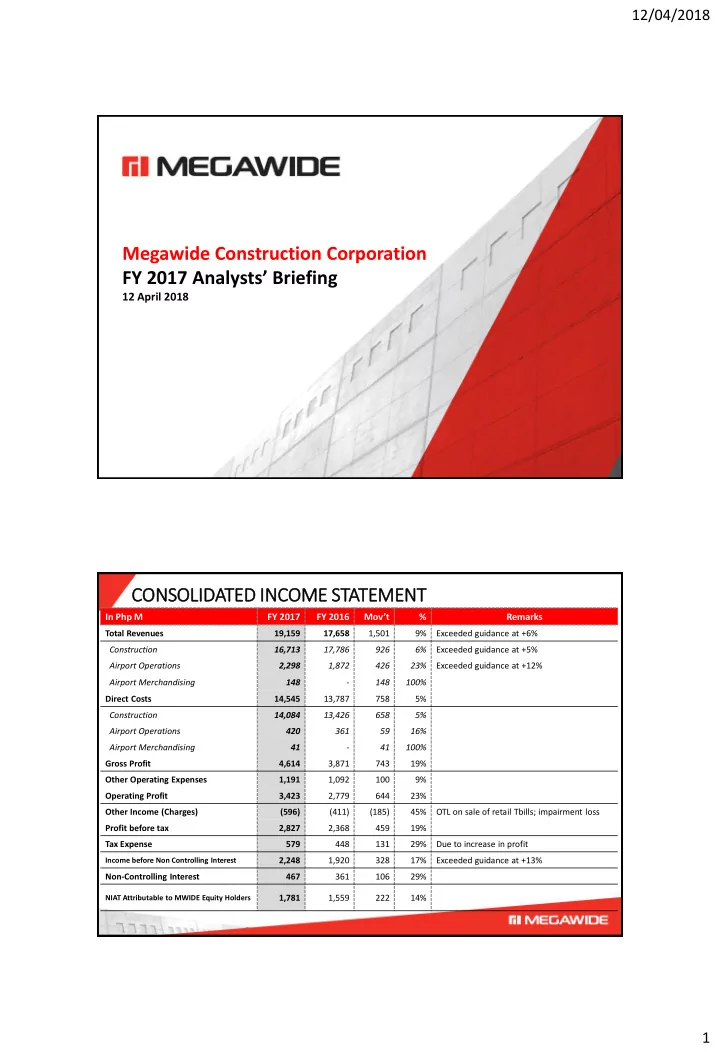
2018 GUIDANCE
887 1,474 1,920 2,248 1,853 2014 2015 2016 2017 E2018
NET INCOME*
1,859 3,030 3,611 4,289 4,949 2014 2015 2016 2017 E2018
EBITDA
10,042 15,442 17,658 19,159 21,366 2014 2015 2016 2017 E2018
REVENUES
+17% +30% +14% +54% +66% +19% +19% +63% *includes minority interest +9% +12% +15% (18%) (In M Php)
200 1,484 1,872 2,298 2,781 90 971 1,302 1,641 1,975 49 501 903 1,115 552
6 12 18 24 30 36 42 48 54 60 66 72 78 84 90 96 102 108 114 120 126 132 138 144 150 156 162 168 174 180 186 192 198 204 210 216 222 228 234 240 246 252 258 264 270 276 282 288 294 300 306 312 318 324 330 336 342 348 354 360 366 372 378 384 390 396 402 408 414 420 426 432 438 444 450 456 462 468 474 480 486 492 498 504 510 516 522 528 534 540 546 552 558 564 570 576 582 588 594 600 606 612 618 624 630 636 642 648 654 660 666 672 678 684 690 696 702 708 714 720 726 732 738 744 750 756 762 768 774 780 786 792 798 804 810 816 822 828 834 840 846 852 858 864 870 876 882 888 894 900 906 912 918 924 930 936 942 948 954 960 966 972 978 984 990 996 1,002 1,008 1,014 1,020 1,026 1,032 1,038 1,044 1,050 1,056 1,062 1,068 1,074 1,080 1,086 1,092 1,098 1,104 1,110 1,116 1,122 1,128 1,134 1,140 1,146 1,152 1,158 1,164 1,170 1,176 1,182 1,188 1,194 1,200 1,206 1,212 1,218 1,224 1,230 1,236 1,242 1,248 1,254 1,260 1,266 1,272 1,278 1,284 1,290 1,296 1,302 1,308 1,314 1,320 1,326 1,332 1,338 1,344 1,350 1,356 1,362 1,368 1,374 1,380 1,386 1,392 1,398 1,404 1,410 1,416 1,422 1,428 1,434 1,440 1,446 1,452 1,458 1,464 1,470 1,476 1,482 1,488 1,494 1,500 1,506 1,512 1,518 1,524 1,530 1,536 1,542 1,548 1,554 1,560 1,566 1,572 1,578 1,584 1,590 1,596 1,602 1,608 1,614 1,620 1,626 1,632 1,638 1,644 1,650 1,656 1,662 1,668 1,674 1,680 1,686 1,692 1,698 1,704 1,710 1,716 1,722 1,728 1,734 1,740 1,746 1,752 1,758 1,764 1,770 1,776 1,782 1,788 1,794 1,800 1,806 1,812 1,818 1,824 1,830 1,836 1,842 1,848 1,854 1,860 1,866 1,872 1,878 1,884 1,890 1,896 1,902 1,908 1,914 1,920 1,926 1,932 1,938 1,944 1,950 1,956 1,962 1,968 1,974 1,980 1,986 1,992 1,998 2,004 2,010 2,016 2,022 2,028 2,034 2,040 2,046 2,052 2,058 2,064 2,070 2,076 2,082 2,088 2,094 2,100 2,106 2,112 2,118 2,124 2,130 2,136 2,142 2,148 2,154 2,160 2,166 2,172 2,178 2,184 2,190 2,196 2,202 2,208 2,214 2,220 2,226 2,232 2,238 2,244 2,250 2,256 2,262 2,268 2,274 2,280 2,286 2,292 2,298 2,304 2,310 2,316 2,322 2,328 2,334 2,340 2,346 2,352 2,358 2,364 2,370 2,376 2,382 2,388 2,394 2,400 2,406 2,412 2,418 2,424 2,430 2,436 2,442 2,448 2,454 2,460 2,466 2,472 2,478 2,484 2,490 2,496 2,502 2,508 2,514 2,520 2,526 2,532 2,538 2,544 2,550 2,556 2,562 2,568 2,574 2,580 2,586 2,592 2,598 2,604 2,610 2,616 2,622 2,628 2,634 2,640 2,646 2,652 2,658 2,664 2,670 2,676 2,682 2,688 2,694 2,700 2,706 2,712 2,718 2,724 2,730 2,736 2,742 2,748 2,754 2,760 2,766 2,772 2,778 2,784 2,790 2,796 2,802 2,808 2,814 2,820 2,826 2,832 2,838 2,844 2,850 2,856 2,862 2,868 2,874 2,880 2,886 2,892 2,898 2,904 2,910 2,916 2,922 2,928 2,934 2,940 2,946 2,952 2,958 2,964 2,970 2,976 2,982 2,988 2,994 3,000
2014 2015 2016 2017 E2018
AIRPORT*
2018 SE SEGMENT GUIDANCE
9,842 13,958 15,786 16,713 18,585 1,769 2,059 2,300 2,584 2,974 838 973 1,017 1,090 1,301
1,000 2,000 3,000 4,000 5,000 6,000 7,000 8,000 9,000 10,000 11,000 12,000 13,000 14,000 15,000 16,000 17,000 18,000 19,000
500 ,000 ,500 ,000 ,500 ,000 ,500 ,000
2014 2015 2016 2017 E2018
CONSTRUCTION
Revenue EBITDA Net Income
+642% +26% +23% +6% +42% +13% +24% +26% +7% +12% In M Php
- P24bn new contracts for 2018,
including Clark EPC of P4.8bn
- EBITDA to grow while NIAT to contract due to
recognition of dep’n and interest expense with the opening of T2 by June 2018
+11% +15% +19% +21% +20% 50%) * Excludes Airport Merchandising