
Confounders and Corfield: Back to the Future 12 July, 2018 2018-Schield-ICOTS-slides.pdf 1
2018 ICOTS-10 0G 1Milo Schield, US
Fellow: American Statistical Assoc. US Rep: International Statistical Literacy Project
2018 ICOTS-10 Kyoto, Japan
www.StatLit.org/pdf/2018-Schield-ICOTS-Slides.pdf www.StatLit.org/pdf/2018-Schield-ICOTS.pdf www.StatLit.org/pdf/2018-Schield-ICOTS1.pdf
Confounding and Cornfield: Back to the Future
2018 ICOTS-10 0G 2Teenager Marty McFly travels back in time.
Back to the Future: The Movie
2018 ICOTS-10 0G 3He changes his parents’ past. This changes their future.
Back to the Future: The Movie
Statistical educators need to go back to the past to change the future.
2018 ICOTS-10 0G 4Good news: Numbers are up:
- More US secondary students taking AP Stats.
- More colleges offering statistics majors/minors.
Bad news: Satisfaction is down:
- Most students see less value in statistics
after they take the course than they did before
- AP students don’t take more stats
WHY???
Statistical Education: The Present
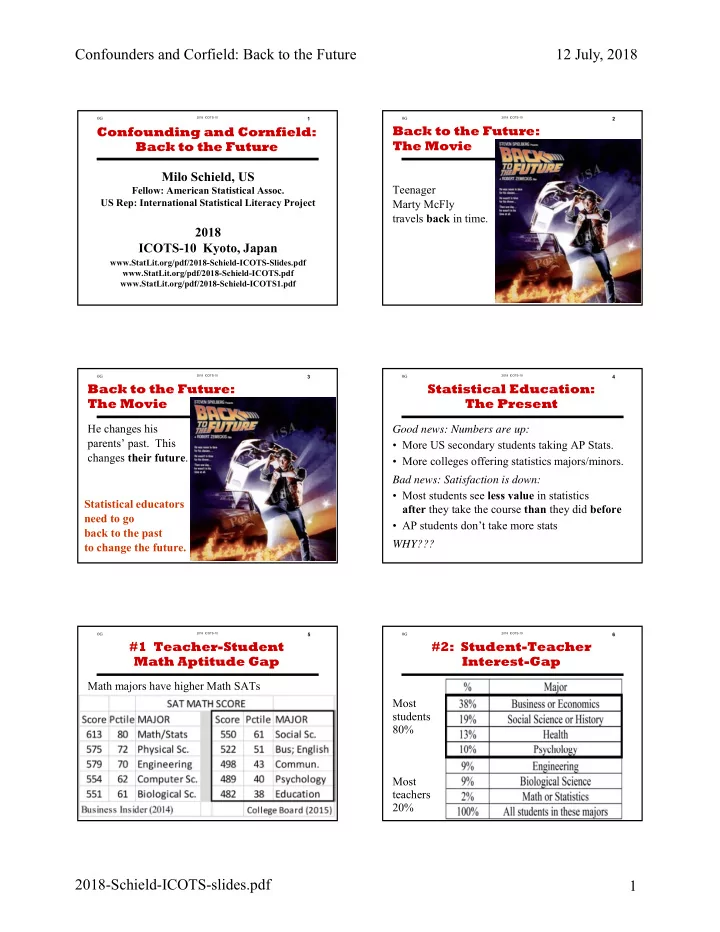
2018 ICOTS-10 0G 5Math majors have higher Math SATs
#1 Teacher-Student Math Aptitude Gap
2018 ICOTS-10 0G 6Most students 80% Most teachers 20%
#2: Student-Teacher Interest-Gap