
Good and poor cognitive performers differ at nutrient intake level
Belina Ferreira-Rodrigues 1,2,3, Carlos Portugal-Nunes 1,2,3 , Teresa Castanho 1,2,3 , Nuno Sousa 1,2,3 , Nadine Santos 1,2,3.
1 - Life and Health Sciences Research Instjtute (ICVS), School of Health Sciences, University of Minho, Braga, Portugal 2-ICVS/3B's, PT Government Associate Laboratory, Braga/Guimarães, Portugal 3- Clinical Academic Center – Braga, Braga, Portugal
Introductjon
Ageing is a critjcal issue worldwide. In Portugal, estjmates of 2016 indicated that 2.1 million people were aged 65 years old or older, accountjng for 20% of the populatjon.
Normal ageing is associated not only with global cognitjve functjon decline but also with impaired cognitjve fmexibility, processing speed and short-term memory.
Nutritjonal status, food patuerns, food groups and intake of certain nutrients infmuence the global cognitjve functjon. Thus, overall the literature suggests that adherence to a healthy dietary patuern is associated with less cognitjve decline and/or a lower risk of dementja. However, fjndings are inconsistent and more research is warranted to determine the mechanisms.
Hence, we explored the cross-sectjonal relatjonship between good and poor cognitjve performance and dietary intake in older community dwellers.
The following date are preliminary results obtained from a cross-sectjonal analysis.
Methods
- A representatjve sample of the Portuguese older populatjon (n=1051) with respect to age, gender
and educatjon, from Guimarães and Vizela, underwent a batuery of neurocognitjve tests. Afuer a principal component analysis of a subsample have identjfjed four signifjcant dimensions of the cognitjve functjon, four clusters have arisen: “very good”, “good”, “poor” and “very poor” cognitjve
- performers. Of those, 60 partjcipants of the “very good” and 60 partjcpants of the “very poor”
clusters are being followed-up since 2012. In the present poster “very good” and “very poor” performers will be referred as good and poor performers, respectjvely.
- In the fjrst wave of assessment (2012), data on dietary intake was collected via 24-hour dietary
recall (n=105) by an experienced dietjtjan.
- Nutrients intakes were determined by Nutrilog SAS sofuware (version 2.3).
- Afuer testjng the assumptjons independent t-tests and Mann-Whitney test were run between poor
and good performance groups to determine whether there were statjstjcal difgerences.
Results Conclusions
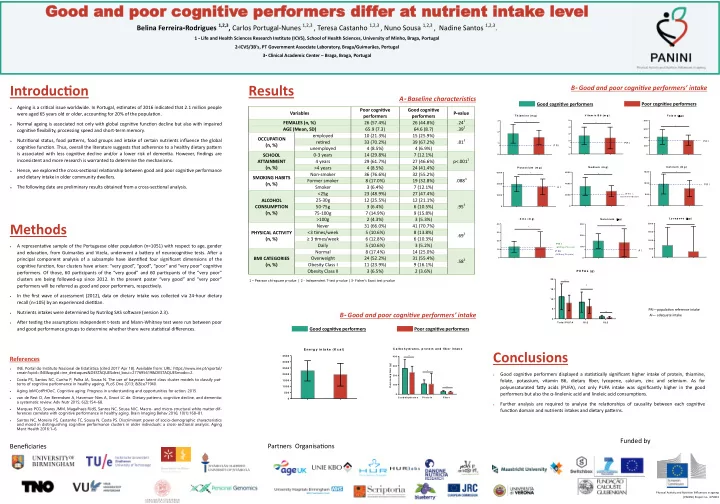
- Good cognitjve performers displayed a statjstjcally signifjcant higher intake of protein, thiamine,
folate, potassium, vitamin B6, dietary fjber, lycopene, calcium, zinc and selenium. As for polyunsaturated fatuy acids (PUFA), not only PUFA intake was signifjcantly higher in the good performers but also the α-linolenic acid and linoleic acid consumptjons.
- Further analysis are required to analyse the relatjonships of causality between each cognitjve
functjon domain and nutrients intakes and dietary patuerns.
References
- INE. Portal do Instituto Nacional de Estatística [cited 2017 Apr 18]. Available from: URL: https://www.ine.pt/xportal/
xmain?xpid=INE&xpgid=ine_destaques&DESTAQUESdest_boui=277695619&DESTAQUESmodo=2.
- Costa PS, Santos NC, Cunha P, Palha JA, Sousa N. The use of bayesian latent class cluster models to classify pat-
terns of cognitive performance in healthy ageing. PLoS One 2013; 8(8):e71940.
- Aging IoMCotPHDoC. Cognitive aging: Progress in understanding and opportunities for action; 2015.
- van de Rest O, Am Berendsen A, Haveman-Nies A, Groot LC de. Dietary patterns, cognitive decline, and dementia:
a systematic review. Adv Nutr 2015; 6(2):154–68.
- Marques PCG, Soares JMM, Magalhaes RJdS, Santos NC, Sousa NJC. Macro- and micro-structural white matter dif-
ferences correlate with cognitive performance in healthy aging. Brain Imaging Behav 2016; 10(1):168–81.
- Santos NC, Moreira PS, Castanho TC, Sousa N, Costa PS. Discriminant power of socio-demographic characteristics
and mood in distinguishing cognitive performance clusters in older individuals: a cross-sectional analysis. Aging Ment Health 2016:1–6.
Partners Organisatjons Benefjciaries
Physical Actjvity and Nutritjon INfmuences in ageing (PANINI) Project no. 675003
Funded by
Variables Poor cognitjve performers Good cognitjve performers P-value FEMALES (n, %) 26 (57.4%) 26 (44.8%) .241 AGE (Mean, SD) 65.9 (7.3) 64.6 (8.7) .392 OCCUPATION (n, %) employed 10 (21.3%) 15 (25.9%) .813 retjred 33 (70.2%) 39 (67.2%) unemployed 4 (8.5%) 4 (6.9%) SCHOOL ATTAINMENT (n, %) 0-3 years 14 (29.8%) 7 (12.1%) p<.0011 4 years 29 (61.7%) 27 (46.6%) >4 years 4 (8.5%) 24 (41.4%) SMOKING HABITS (n, %) Non-smoker 36 (76.6%) 32 (55.2%) .0883 Former smoker 8 (17.0%) 19 (32.8%) Smoker 3 (6.4%) 7 (12.1%) ALCOHOL CONSUMPTION (n, %) <25g 23 (48.9%) 27 (47.4%) .953 25-30g 12 (25.5%) 12 (21.1%) 50-75g 3 (6.4%) 6 (10.5%) 75-100g 7 (14.9%) 9 (15.8%) >100g 2 (4.3%) 3 (5.3%) PHYSICAL ACTIVITY (n, %) Never 31 (66.0%) 41 (70.7%) .693 <3 tjmes/week 5 (10.6%) 8 (13.8%) ≥ 3 tjmes/week 6 (12.8%) 6 (10.3%) Daily 5 (10.6%) 3 (5.2%) BMI CATEGORIES (n, %) Normal 8 (17.4%) 14 (25.0%) .583 Overweight 24 (52.2%) 31 (55.4%) Obesity Class I 11 (23.9%) 9 (16.1%) Obesity Class II 3 (6.5%) 2 (3.6%)
B- Good and poor cognitjve performers’ intake
Good cognitjve performers Poor cognitjve performers
1 – Pearson chi-square p-value | 2 - Independent T-test p-value | 3- Fisher’s Exact test p-value
A- Baseline characteristjcs
T h ia m in e (m g )
1 2 3
P R I * V ita m in B 6 (m g )
1 2 3 4 5
P R I * P o ta s s iu m (m g )
2 0 0 0 4 0 0 0 6 0 0 0
A I * S o d iu m (m g )
2 0 0 0 4 0 0 0 6 0 0 0 W H O ´s re co m m e n d a tio n
* C a lc iu m (m g )
5 0 0 1 0 0 0 1 5 0 0
P R I * Z in c (m g )
1 0 2 0 3 0 4 0
P R I
(3 0 0 m g P h yta te )
* P R I
(6 0 0 m g P h yta te )
F o la te ( g )
2 0 0 4 0 0 6 0 0 8 0 0
P R I *
P U F A s (g )
T o ta l P U F A 1 8 :2 1 8 :3 5 1 0 1 5 2 0
* * *
B- Good and poor cognitjve performers’ intake
Good cognitjve performers Poor cognitjve performers
S e le n iu m ( g )
1 0 0 2 0 0 3 0 0
A I *
PRI—populatjon reference intake AI— adequate intake
L y c o p e n e ( g )
5 0 0 1 0 0 0 1 5 0 0 2 0 0 0
*
C a rb o h y d ra te s , p ro te in a n d fib e r in ta k e
C o n s u m p tio n (g )
C a rb o h yd ra te s P ro te in F ib e r 1 0 0 2 0 0 3 0 0 4 0 0
* * *
E n e rg y in ta k e (K c a l)
5 0 0 1 0 0 0 1 5 0 0 2 0 0 0 2 5 0 0 3 0 0 0 3 5 0 0