
SLIDE 1
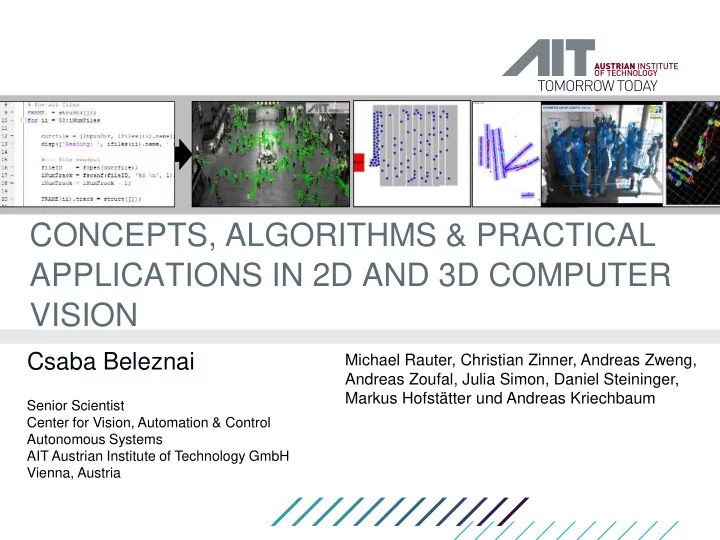
CONCEPTS, ALGORITHMS & PRACTICAL APPLICATIONS IN 2D AND 3D COMPUTER VISION
Michael Rauter, Christian Zinner, Andreas Zweng, Andreas Zoufal, Julia Simon, Daniel Steininger, Markus Hofstätter und Andreas Kriechbaum
Senior Scientist Center for Vision, Automation & Control Autonomous Systems AIT Austrian Institute of Technology GmbH Vienna, Austria
Csaba Beleznai