community safety night
play

Community Safety Night 1 On behalf of the Upper Avenue Community - PDF document

Community Safety Night 1 On behalf of the Upper Avenue Community Association and the South Armour Heights Residents Association, I would like to thank you for attending our first Community Safety Night. Each of our Residents Associations


  1. Community Safety Night 1 
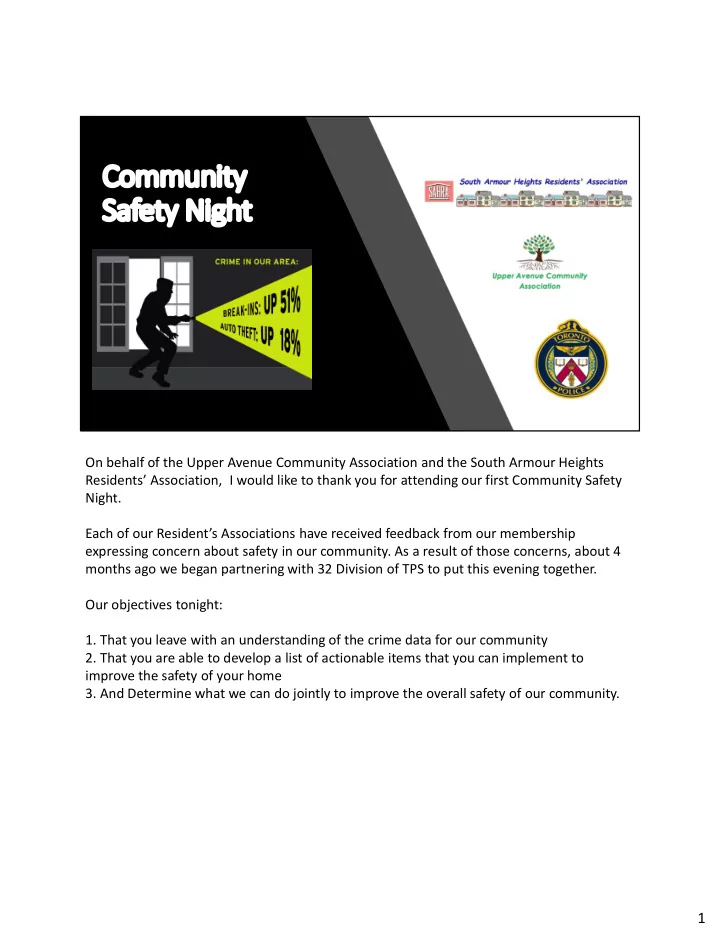
On behalf of the Upper Avenue Community Association and the South Armour Heights Residents’ Association, I would like to thank you for attending our first Community Safety Night. Each of our Resident’s Associations have received feedback from our membership expressing concern about safety in our community. As a result of those concerns, about 4 months ago we began partnering with 32 Division of TPS to put this evening together. Our objectives tonight: 1. That you leave with an understanding of the crime data for our community 2. That you are able to develop a list of actionable items that you can implement to improve the safety of your home 3. And Determine what we can do jointly to improve the overall safety of our community. 1

  2. Our team • 32 Division: • Sgt. Jon Collin • Constable Sherri Spivak • Jim Sadler (SAHRA) • Ron Johnson (SAHRA) • Mary Carrier (UACA) • Donna MacCandlish (UACA) • Paul Freer (UACA) • Pam Main (UACA) 2 I would like to introduce our distinguished guests and our Committee for this event. MPP Robin Martin, MPP for Eglinton – Lawrence Caroline Duffy, Outreach and Policy Assistant for Councillor Mike Colle (Mike unfortunately was not able to attend this evening). From TPS: Sgt. Jon Collin – Jon also leads the Community Police Liaison Would also like to acknowledge Constable Susan Stam, Crime Prevention Officer. Susan has also been working with us on this event since December. 2

  3. Our fabulous sponsors on Avenue Road 3 To our very generous Avenue Road sponsors who contributed to the finances for this evening. 3

  4. Agenda • Toronto Police Service • Crime data trending • Crime Reporting • Home Security • How we compare –Toronto wide • Crime data trending within our neighbourhood (sub-areas) • What Can We Do Together? • Individual homes and vehicles • Community • Residents’ Associations • Q & A • MPP Robin Martin • Draw 4 The map shown here illustrates each of our RA catchment areas. For UACA, bounded on the north by Wilson south to Lawrence, and Avenue Road west to Bathurst. For SAHRA – East of Avenue Road – from 401 south to Brook and east to Yonge Boulevard. Our two areas together make up the ‘BEDFORD PARK NORTOWN” CITY OF TORONTO NEIGHBOURHOOD 4

  5. 32 Division • Crime data trending • Crime reporting • Home security 5 5

  6. Break and Enter 6  The yearly average is 71. 2017 and 2018 was higher than the pervious years. With 83 and 79  The monthly Average is 29. March, April, August and December were higher ranging from 36 to 41. May and October were considerably lower with 19 each.  The average per day of the week is 50 Friday was high with 65 and Sunday was the lowest with 34. 6

  7. Break and Enter by year 7 7

  8. Break and Enter by Month 8 8

  9. Break and Enter by Day 9 9

  10. Theft of Vehicle 10  The yearly average is 34. 2017 with 41 and 2018 with 42 were higher than the pervious years. 2016 was the lowest with 17.  The monthly Average is 14. July and September were higher with 4 each. January with 4 and February with 7 were considerably lower than the average.  The average per day of the week is 24. Sunday with 2 and Friday with 3 were low days of the week. Tuesday with 30 Wednesday with 33 and Thursday with 29 were above average. 10

  11. Theft of Vehicle by Year 11 11

  12. Theft of Vehicle by Month 12 12

  13. Theft of Vehicle by Day 13 13

  14. Theft from Vehicle 14  The yearly average is 56. 2017 with 67 and 2018 with 62 were higher than the pervious years. 2016 was considerably lower with 40.  The monthly Average is 23. January and August with 35 were higher with 65 each. June and September with 14 were considerably lower than the average.  The average per day of the week is 39. Sunday with 33 and Wednesday with 31 were low days of the week. Tuesday, Friday and Saturday with 44 each were above average. 14

  15. Theft from Vehicle by Year 15 15

  16. Theft from Vehicle by Month 16 16

  17. Theft from Vehicle by Day 17 17

  18. 18 2019 Crime Stats From Jan 1 st to April 15 th 18

  19. 2019 Jan 1 st to April 15th 19 19

  20. 2019 Jan 1 st to April 15th 20 20

  21. 2019 Jan 1 st to April 15th 21 21

  22. How to Report 22 22

  23. Home Security How to protect your home 23 23

  24. Crime Prevention Definition “The anticipation, recognition, and appraisal of a crime risk, and the initiation of some action to remove or reduce it.” 24 24

  25. Crime Prevention Through Environmental Design (CPTED)  Never look at a property the same way again.  Question everything  Look at your house from a criminal’s perspective.  Increase criminals’ risk and /or effort through:  Natural surveillance  Access control  Territorial reinforcement 25 CPTED- influences how people behave. Marked pathways, fences, and signs. They all give people direction as to what to do when they approach your property. 25

  26. Natural Surveillance  A design strategy directed at keeping intruders under observation.  Natural surveillance provides for witness potential.  Many factors can influence natural surveillance. 26 26

  27. Factors Affecting Natural Surveillance  Design  Shrinking lot sizes and larger homes has resulted in front doors disappearing behind the garage.  Landscaping  Often attracts criminals who recognize a good opportunity and inhibits the ability to keep intruders under observation. i.e. large trees/shrub  Fencing  Privacy fences compromise ground level surveillance- criminals love privacy! 27 Criminals love hidden doorways. They can operate without being seen. Landscaping-trim back shrubs-trim up trees. Again criminals want to operate out of sight. Neighbours can’t see what’s going on. Fencing- wrought iron or spaced fencing is ideal. 27

  28. Natural Surveillance cont’d  Privacy vs. security  Introduction of 1 inch air space provides for privacy without compromising natural surveillance.  Wrought iron fence provides a person to see through it.  Lighting  A lack of lighting may send a message to criminals that no one is home.  Lighting provides the ability to see  Motion lighting-can deter criminals 28 28

  29. Access Control  A design strategy directed at decreasing crime opportunity and increasing the perception of risk in offenders.  Fences  Capable of guiding and influencing movement  Marks property  Proper fence can create proper protection 29 29

  30. Target Hardening  Front doors  Door kicks are common  Solution: Longer screw and/or strike plate  Garage doors  Entry through unlocked or opened garage doors  Availability of weapons of opportunity  Solution : Keep doors locked  Sliding doors  Pry door-break lock, Smash window  Solution: Visible deterrent, Bar across the door, Unseen deterrent=pins (through frames in the door) 30 Easy crime prevention tools. Look at your front door. A good lock(dead bolt) with a longer strike plate and long screws will make your front door a harder target to break. 30

  31. Target Hardening  Windows  Most common entry point:  Easily accessed  Not always locked  Abundance of cover  Solution: Limit adult sized hiding spots, Pin in window, Replace with polycarbonate bars with exit handle 31 31

  32. Prevention  Keep the garage closed and locked except when working in the front yard.  Keep the front door locked while in the home or backyard.  Keep gates around the home locked except when actively being used.  Avoid storing ladders outdoors or positioning air conditioning condensers near windows.  Never “hide” keys outside. 32 We are creatures of habit and criminals know this. They will check under the matt for a hidden key or in a mailbox. Avoid having anything around the outside that will assist a criminal in breaking into your home. 32

  33. What to do in the event you discover a break-in  Do NOT enter the house.  Go to a neighbours and call the Police- 911.  Provide suspect information and direction of travel if known.  Watch you property as best as you can.  Provide updates to police. 33 Don’t attempt to clean up or fingerprint yourself. A lot of evidence could be lost. Give as much detail as possible. Talk to your neighbours. They may have seen someone in the area and can provide invaluable information. 33

  34. Agenda • Toronto Police Service • Crime data trending • Crime reporting • Home security • How we compare – Toronto wide • Crime data trending within our neighbourhood (sub-areas) • What Can We Do Together? • Individual homes and vehicles • Community • Residents’ Associations • Q & A 34 Thanks to the Toronto Police Service’s Sgt. Jon Collin. I am Jim Sadler, President of SAHRA. We have a lot to cover still, so let’s get going! We’ll cover some more data and then get into some actionable things that you can do, and we can do together. 34

Download Presentation
Download Policy: The content available on the website is offered to you 'AS IS' for your personal information and use only. It cannot be commercialized, licensed, or distributed on other websites without prior consent from the author. To download a presentation, simply click this link. If you encounter any difficulties during the download process, it's possible that the publisher has removed the file from their server.

Recommend


More recommend