
SLIDE 1
Commercial Banking Investor Update Simon Cooper Group Managing - - PowerPoint PPT Presentation
Commercial Banking Investor Update Simon Cooper Group Managing Director, CEO of Global Commercial Banking March 2015 Important notice and forward-looking statements Important notice The information set out in this presentation and
3
Notes: 1. Net operating income before loan impairment charges and other credit risk provisions, excluding currency translation and significant items 2. Excludes currency translation and significant items 3. Return on average tangible equity measures the return attributable to ordinary shareholders, excluding the impairment of goodwill and the movement in the present value of in-force long-term insurance business (‘PVIF’) net of tax, divided by the average tangible equity, which is defined as the average ordinary shareholders' equity excluding average goodwill, PVIF and other intangibles, net of deferred tax and net of non-controlling interests 4. On 1 January 2014, CRD IV came into force and capital and RWAs at 31 December 2014 are calculated and presented on the Group’s interpretation of final CRD IV legislation and final rules issued by the PRA 5. Total dividends in respect of the year 6. Euromoney 2014 7. Market share: Bloomberg League tables; Bond and Derivatives House of the year: IFR Awards 2014
(416) (4,149) 2013 2014 22,829 22,981
§ Reported PBT of USD18,680m included fines, settlements, UK customer redress, and associated provisions of USD3,709m § 2014 adjusted revenue1 of USD62,002m and adjusted2 PBT of USD22,829m broadly unchanged compared with 2013 § Adjusted2 PBT growth in 3 out of 5 regions § Adjusted2 operating expenses increased by USD2,172m driven by Regulatory Programmes and Compliance and inflationary pressures § ROE of 7.3%; (ROTE3 of 8.5%) Financial performance § Strong capital position with a common equity tier one ratio of 10.9% (transitional basis4) and 11.1% (end point basis4) § Progressive dividend in 2014 of USD0.50 per ordinary share5 Capital and dividends § Maintained leadership position in payments and cash management6 § Increased market share in Capital Financing; Awarded Bond and Derivatives House of the year7 § Increased RMB revenue and volumes, benefiting from accelerating global expansion of RMB § Global Standards: Continued progress in roll out of Global Standards programme Strategy execution Reported and Adjusted2 PBT (USDm)
Adjusted2 PBT broadly unchanged
Currency translation and significant items Adjusted2 PBT Reported
Highlights
22,565 18,680
4
Notes: 1. All figures are reported unless otherwise stated 2. Excludes currency translation and significant items 3. Calculated as percentage growth in adjusted net operating income before loan impairment charges and other credit risk provisions less percentage growth in adjusted operating expenses, 2014 versus 2013 4. On 1 January 2014, CRD IV came into force and capital and RWAs at 31 December 2014 are calculated and presented on the Group’s interpretation of final CRD IV legislation and final rules issued by the PRA. At 31 December 2013, capital and RWAs were also estimated based on the Group’s interpretation of final CRD IV legislation supplemented by guidance provided by the PRA, as applicable, details of which can be found in the basis of preparation
Key ratios, % 2013 2014 KPI Return on average ordinary shareholders’ equity 9.2% 7.3% 12-15% Return on average tangible equity 11.0% 8.5% n/a Cost efficiency ratio 59.6% 67.3% mid-50s Jaws (adjusted)3 n/a (5.8%) Positive Advances-to-deposits ratio 72.9% 72.2% < 90% Common equity tier 1 ratio (transitional basis)4 10.8% 10.9% >10% Common equity tier 1 ratio (end point basis)4 10.9% 11.1% >10% Summary financial highlights, USDbn Better/(worse) 2013 2014 2014 vs 2013 Reported PBT 22.6 18.7 (17)% Adjusted2 PBT 23.0 22.8 (1)%
5
2,791 (754) 2013 2014 73%
Notes: 1. Net operating income before loan impairment charges and other credit risk provisions excluding the effect of currency translation and significant items 2. Includes intersegment revenue variance of USD(503)m. Refer to footnote 55 on page 110 of the 2014 Annual Report and Accounts 3. Includes Markets products, Insurance and Investments and Other
148 829 (307) (148) (278) 833 (569) (212) (1)% (28)% 5% (101)% (2)% (11)% 64,645
61,248
Adjusted revenue1 broadly unchanged
62,002 61,854 Currency translation and significant items Adjusted1 revenue Reported
(500) 500
Principal RBWM USD(212)m USD833m CMB GB&M excl legacy credit Personal lending Current accounts, savings and deposits Wealth products Credit and Lending Global Trade and Receivables Finance Payments and Cash Management Markets Balance Sheet Management Capital Financing, Principal Investments and other USD(278)m Other Other3 FFVA Total Other2 GPB Legacy credit GB&M excl legacy credit CMB RBWM US run-off portfolio Principal RBWM
6
7
531 (196) 2013 2014
8,441 8,744
Adjusted1 PBT up USD1,030m
8,940 7,910 Currency translation and significant items Adjusted1 PBT Reported
Notes: 1. Excluding the effect of currency translation and significant items 2. Net operating income before loan impairment charges and other credit risk provisions excluding the effect of currency translation and significant items
886 (9) 2013 2014
16,365 16,303
Adjusted revenue2 up USD833m
16,312 15,479 Currency translation and significant items Adjusted revenue2 Reported 284 189 2013 2014
7,049 7,489
Adjusted1
up USD535m
7,300 6,765 Currency translation and significant items Adjusted1 operating expenses Reported
Deposits2 A/D ratio3 % fee income Opex CER Loans Revenue4 PBT RoRWA5
10% 84% 86% § Growth primarily in Credit & Lending in Asia reflecting demand for credit, and also in Europe where balances increased in the UK. In addition, CRE and corporate balances were higher in the US from continued business expansion. § Deposit growth in PCM balances driven by deposit acquisition and retention in Asia, as well as growth in the UK due to the success of the 'business deposit acquisition strategy' and improved retention supported by competitive pricing. 16,312 15,479 6,765 7,300 44% 45% § Driven by Credit and Lending and PCM and notably in Hong Kong and the UK. This was due to growth in average lending and deposit balances in Hong Kong and rising average deposit balances and wider lending spreads in the UK. § Higher costs driven by FTE investment and wage inflation, as well union- agreed salary increases in Brazil and Argentina. In addition, operating expenses increased due to higher Regulatory Programmes and Compliance related costs 30% 29% 8,940 7,910 2.1% 2.1% § PBT growth driven by higher revenue and lower LICs, partly offset by higher costs. § Return on Risk Weighted Assets remain broadly stable compared with 2013. 5% 13%
1. All figures are on an adjusted basis, unless stated otherwise 2.
3. On a reported basis 4. Net operating income before loan impairment charges and other credit risk provisions. 5. Return on risk-weighted assets include associates on an adjusted basis. Adjusted RoRWA calculated using adjusted PBT and average RWAs on a constant currency basis adjusted for the impact of significant items
(USDbn) (USDm)
8
7% (USDm) 8%
2,625 2,680
Credit & Lending Payments & Cash Management GTRF Markets products, Insurance & Investments & Other MENA North America Latin America Asia Europe 2013 2014 2013 2014
Notes: 1. On an adjusted basis. Net operating income before loan impairment charges and other credit risk provisions, also referred to as revenue. 2. Product revenues have been restated to reclassify Foreign Exchange revenue included within Global Trade and Receivables Finance and Payments and Cash Management into Markets products, Insurance and Investments and Other. In 2014, Markets products, Insurance and Investments and Other included Foreign Exchange revenue of USD207m previously included within Global Trade and Receivables Finance (2013: USD213m) and USD516m previously included within Payments and Cash Management (2013: USD462m).
2014 vs 2013 2014 vs 2013
9
1Q11 3Q11 1Q12 3Q12 1Q13 3Q13 1Q14 3Q14
Notes: 1. Source: Oxford Economics (June 2014) 2. Total CMB loans and advances on a constant currency basis
1% 2% 3% 4% 2011 2012 2013 2014 2015
10
4Q14
(USDm)
the portfolio and improved economic environment
relating to homebuilders, and a lower collective LICs in Brazil
China and Hong Kong.
Notes: 1. On a reported basis. 2. Annualised quarterly LICs / five point average period end loans and advances.
2
0.0% 0.2% 0.4% 0.6% 0.8% 1.0% 1.2% 1.4% 200 400 600 800 1,000 1,200 1Q10 3Q10 1Q11 3Q11 1Q12 3Q12 1Q13 3Q13 1Q14 3Q14 LICs LICs / Average Assets
1Q13 2Q13 3Q13 4Q13 1Q14 2Q14 3Q14 4Q14 1Q13 2Q13 3Q13 4Q13 1Q14 2Q14 3Q14 4Q14
11
4Q14
2013 Revenue Balance Sheet Growth Spread Compression NFI and Other Income 2014 Revenue
105 135 165
2009 2010 2011 2012 2013 1Q14 2Q14 3Q14
Merchandise Exports
Notes: 1. WTO Quarterly world merchandise exports by region and selected economies. Indexed to 100 in 1Q2009 2. On an adjusted basis which excludes currency translations and significant items. Foreign Exchange revenue has been reclassified into Markets products, Insurance & Investments and Other. In 2014, Foreign Exchange revenue was USD207m within Global Trade and Receivables Finance (2013: USD213m). 3. 2014 awards: ‘Best Trade Bank in the World’ Trade and Forfaiting Review, ‘Best Global Trade Finance Bank’ Global Trade Review, ‘Best supply-chain finance bank' and ‘Best factoring institution’ Trade Finance Magazine
Overall merchandise exports remained broadly flat over the last 3 years
1
12
0.0 0.2 0.4 0.6 0.8 1.0 200 250 300 350 4Q12 4Q13 4Q14 PCM Liabilities Balances (USDbn) USD 12-m Libor Rates
Notes: 1. Period end balances on a constant currency basis 2. 2Q14 balances include a c.USD9bn boundary change from Retail Money Market Deposits
+12%2
Europe exc UK Asia exc HK
MENA
NAM LATAM UK HK
13
15
RMB Global Trade & Receivables Finance Payments & Cash Management Foreign Exchange Network
Large Corporate Mid-market Enterprises Business Banking
16
17
Notes: 1. Adjusted profit before tax also excludes currency translation, the effect of acquisitions, disposals and reclassifications, and FVOD 2. In the first quarter of 2013 the private banking operations of HSBC Private Bank Holdings (Suisse) SA in Monaco were classified as held for sale. At this time, a loss on reclassification to held for sale was recognised following a write down in the value of goodwill allocated to the operation. Following a strategic review we decided to retain the operation, and the assets and liabilities of the business were reclassified to the relevant balance sheet categories, however the loss on reclassification was not reversed
USDm For the year-ending 31 December 2013 2014 Includes the following significant items (reported basis): Revenue Restructuring and repositioning: Net gain on completion of Ping An disposal 553
442
(279)
(199)
(146)
(271)
(123) 168 Gain on sale of shareholding in Bank of Shanghai
Impairment of our investment in Industrial Bank
Volatility: Debit valuation adjustment on derivative contracts 106 (332) Fair value movements on non-qualifying hedges 511 (541) Customer redress: Provisions arising from the ongoing review of compliance with the Consumer Credit Act in the UK
594 (1,180) Operating expenses Restructuring and repositioning: Restructuring and other related costs (483) (278) Customer redress and litigation-related charges: Charge in relation to the settlement agreement with Federal Housing Finance Authority
Settlements and provisions in connection with foreign exchange investigations
UK customer redress programmes (1,235) (1,275) Regulatory provisions in GPB (352) (65) US customer remediation provisions relating to CRS (100)
(298)
Accounting gain arising from change in basis of delivering ill-health benefits in the UK 430
(3,355)
18
USDm For the year-ending 31 December 2013 2014 Net interest income 9,900 10,515 Net fee income 4,643 4,733 Net trading income 621 617 Other income 315 447 Net operating income before loan impairment charges and other credit risk provisions 15,479 16,312 Loan impairment charges and other credit risk provisions (2,340) (1,677) Net operating income 13,139 14,636 Total operating expenses (6,765) (7,300) Operating profit 6,374 7,336 Share of profit in associates and joint ventures 1,536 1,604 Adjusted Profit before tax 7,910 8,940 Reported Profit before tax 8,441 8,744 Cost efficiency ratio 43.7 44.8 Jaws% (2.5) Loans and advances 284,935 313,999 Customer accounts 339,325 363,654 A/D Ratio % 84.0 86.3
Note: 1. All numbers are adjusted basis, unless stated otherwise.
19
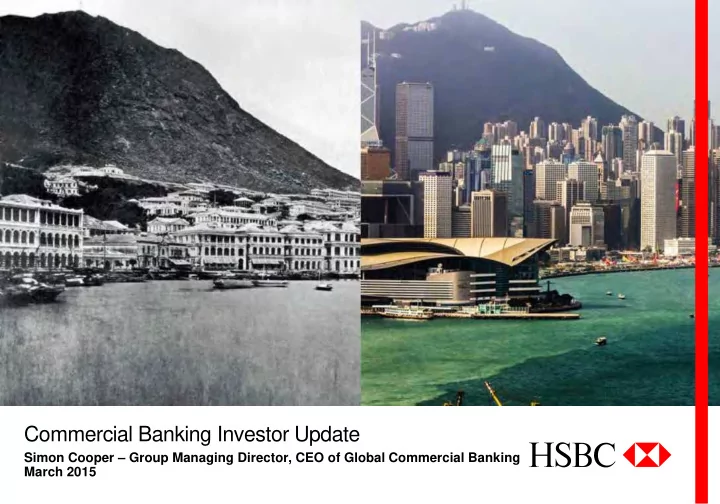
Issued by HSBC Holdings plc Group Investor Relations 8 Canada Square London E14 5HQ United Kingdom Telephone: 44 020 7991 3643 www.hsbc.com Cover images: HSBC – then and now It is 150 years since HSBC was founded in Hong Kong to finance trade between Asia and Europe. Much has changed since then, as our cover photos demonstrate. The left photo shows Hong Kong harbour, with the HSBC office (extreme left) a few years after it was established in 1865. The right image shows the harbour today, with the HSBC building fifth from left (partially hidden). Hong Kong has been transformed both physically and economically, from trading outpost to international financial centre. HSBC has mirrored Hong Kong’s rise to global prominence, growing from a small regional trading bank into one of the world’s largest banking and financial services organisations today. HSBC’s Hong Kong office is still at 1 Queen’s Road Central, as it was in 1865. The current HSBC building is the fourth to occupy the site, but the values on which the bank was founded remain the same. HSBC still aims to be where the growth is, connecting customers to opportunities, enabling businesses to thrive and economies to prosper, and helping people to fulfil their hopes and realise their ambitions. We are proud to have served our customers with distinction for 150 years. Photographs: (left) HSBC Archives; (right) Matthew Mawson Cover designed by Creative Conduct Ltd, London. 02/15