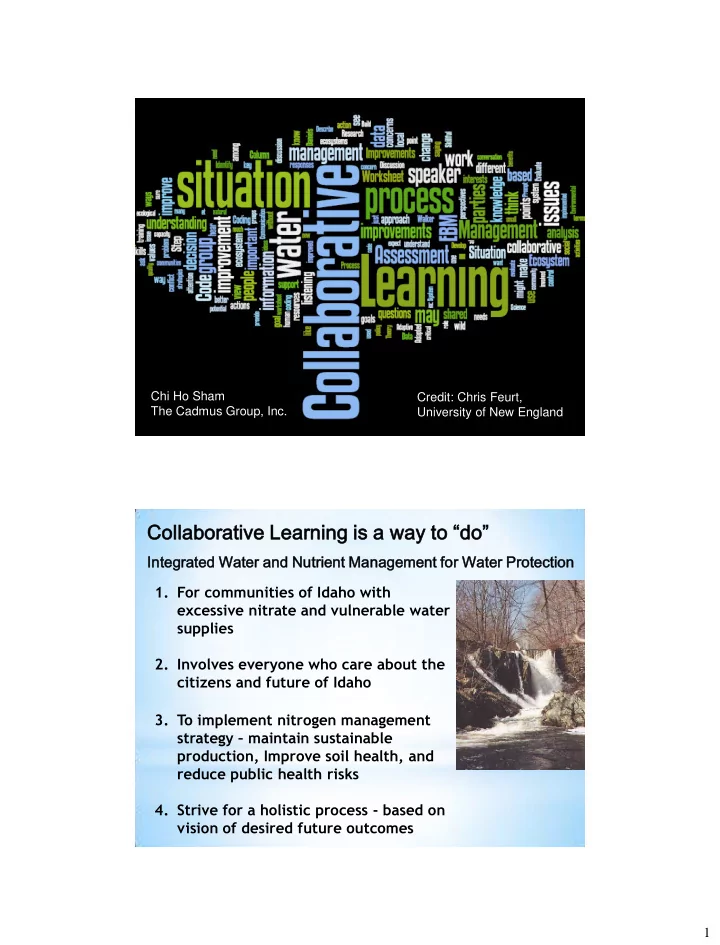
SLIDE 5 5
*
Most promising idea How will this idea improve the situation? OUTCOME What actions would make this idea a reality? Who needs to be involved to implement the idea? What do we need to be aware of?
Identify areas that are both priority nutrient reduction areas and susceptible water supply areas for implementation
reduction practices to reduce nitrate concentration Guidance and management actions can be targeted at priority areas/ vulnerable areas to reduce nutrient inputs that can improve water quality
nutrient reduction priority areas with time-of-travel areas of vulnerable water supplies
rank drinking water quality data to identify hotspots
with producers for nutrient reduction implementation
- 1. Producers
- 2. Crop advisor
- 3. NRCS
- 4. FSA
- 5. IDEQ
- 6. USGS
- 1. Take action to
find evidence for and quantify effects of nutrient reduction on the lowering of nitrate concentration in groundwater.
examine our assumptions and identify the source of inputs.
Ideas for Action
*
Action Items Measures of Success Accountability Comments
quality data after implementation of nutrient reduction strategy Water quality data are collected with sufficient geographic coverage and sampling timeframe Water system
municipal staff Identify gaps in coverage of existing sampling regime. Share results within the sampling network.
water quality data for comparison purposes Water quality improvement
implementation of nutrient reduction practices Producers and ag. agencies Change in water quality will take
important to specify timeline.
Measures of Success