Collaborative data resources TIPharma PKPD modeling platform - - PowerPoint PPT Presentation

collaborative data resources tipharma pkpd modeling
SMART_READER_LITE
LIVE PREVIEW

Collaborative data resources TIPharma PKPD modeling platform - - PowerPoint PPT Presentation

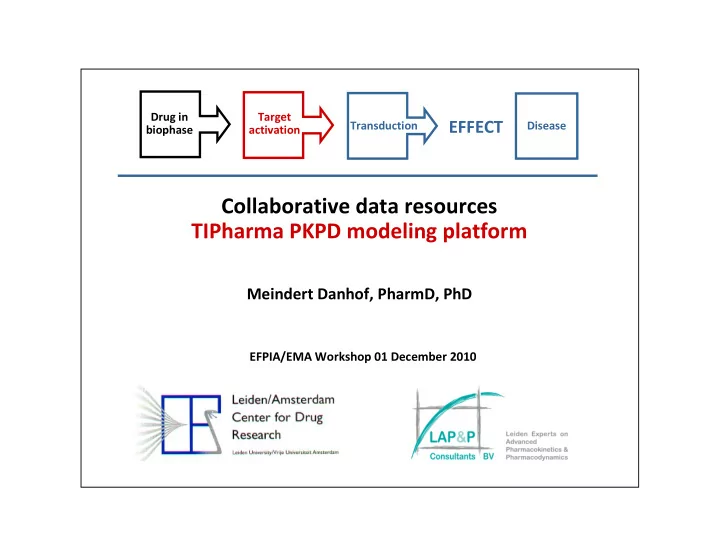
Drug in Target EFFECT Transduction Disease biophase activation Collaborative data resources TIPharma PKPD modeling platform Meindert Danhof, PharmD, PhD EFPIA/EMA Workshop 01 December 2010 Quantitative systems pharmacology utility of


slide-1
SLIDE 1

Collaborative data resources TIPharma PKPD modeling platform

Meindert Danhof, PharmD, PhD

EFPIA/EMA Workshop 01 December 2010

EFFECT

Drug in biophase Target activation Transduction Disease

slide-2
SLIDE 2

Drug Dosing Pharmacology Exposure Response Disease Progression

Biological system

Outcome Efficacy Safety

Species Subject

Between system variation

Stationarity E-factors

Within system variation

Quantitative systems pharmacology utility of collaborative data resources

slide-3
SLIDE 3

TI Pharma mechanism-based PKPD modeling platform the objective

Development and implementation of a mechanism-based PKPD modeling platform as the scientific basis for rational drug discovery and innovation

  • Database of ‘biological system specific’ ..

…information

  • Mechanism-based PKPD model library
slide-4
SLIDE 4
  • University-industry consortium with 4 academic and 8

industrial partners

  • Dedicated infrastructure for data management, data

analysis and reporting: sharing of data, models and biological system specific information

  • Emphasis on key factors in the discovery/development

and the clinical application of novel drugs

– Translational pharmacology (efficacy and safety) – Developmental pharmacology (pediatrics, elderly) – Disease system analysis (osteoporosis, COPD)

TI Pharma mechanism-based PKPD modeling platform the organization

slide-5
SLIDE 5
  • Development of mechanism-based PK-PD models on

basis of existing data

  • Strict data access restrictions
  • Centralized computing network facility for data

management and analysis

  • Model library interface for users

TI Pharma mechanism-based PKPD modeling platform the operation

slide-6
SLIDE 6

Data Data Data Draft Model

Pooled Data

Publication

Partner: Platform: Manager: Modeler: Partner: Public domain:

Final Model

TI Pharma mechanism-based PK-PD modeling platform the information flow

Data analysis

slide-7
SLIDE 7

TI Pharma mechanism-based PK-PD modeling platform the database system

slide-8
SLIDE 8

Drug N Dose Variables used for modelling & simulation and sampling scheme Moxifloxacin

  • 4

3, 10, 30 mg/kg Clock time, RR, QT over 24 h plasma PK from literature

  • 137

400mg Clock time, RR, QT, plasma PK over 24 h Sotalol

  • 4

4, 8 mg/kg Clock time, RR, QT over 48h, plasma PK literature

  • 30

160 mg Clock time, RR, QT, plasma PK over 24 h Cisapride

  • 4

0.6, 2, 6 mg/kg Clock time, RR, QT, plasma PK over 24 h, plasma PK from literature

  • 24

10, 20, 40, 80 mg Clock time, RR, QT, plasma PK over 24 h NCE

  • 4

1.5 μg Clock time, RR, QT, plasma PK over 24 h,

  • 24

1.5 μg Clock time, RR, QT, plasma PK over 24 h

Prediction of pharmacology in man cardiovascular safety

slide-9
SLIDE 9

Animal to human extrapolation of in vivo concentration-effect relations

slide-10
SLIDE 10

Translational slope drug effect in conscious dogs vs. clinical studies QTc slope for clinical studies QTc slope for conscious dog studies

0.08 0.06 0.04 0.02 0.00 0.00 0.02 0.04 0.06 0.08

moxifloxacin sotalol cisapride

Indentifying the animal to human translation function for QTc interval prolongation

  • ther compounds

test compound

slide-11
SLIDE 11

“Rotterdam study”

  • Baseline = sex; linear increase with age
  • Co-morbidities = heart failure, MI, diabetes
  • Co-medication = anti-arrhythmics
  • Between subject variability

Prediction of cardiovascular risk in real life situations not in trial simulation

QTc = baseline + drug effect + co-morbidities + co-medications + ε

Drug effect QTc = QT0 x RRα · (1 + A · cos(2π/24 · (clocktime – φ)) + slope · C)

slide-12
SLIDE 12

Prediction of cardiovascular risk in real life situations not in trial simulation

  • !

!

  • !

!

  • "

"

  • !

!

  • "

"

  • ""#

""#

  • !

!

  • !

!

  • ""#

""#

  • !

!

#$%&'( #$%&'(

slide-13
SLIDE 13
  • Not in trial simulation to predict natural variation in QTc

in the target population

  • Analyze relationship between variation in QTc and

cardiovascular risk in the target population – Delta analysis – Threshold analysis

  • Develop and incorporate cardiovascular risk prediction

model

Prediction of cardiovascular risk from ECG findings to sudden cardiac death

Prediction of cardiovascular risk

slide-14
SLIDE 14

Quantitative Systems Pharmacology utility of collaborative data resources

Interspecies variation Time variant changes Disease progression Clinical trials Clinical

  • utcome

Drug treatment Non- stationarity Disease progression Clinical trials Clinical

  • utcome

The concepts

  • Physiologically-based PK modeling
  • Mechanism-based PD modeling
  • Disease system analysis
  • Clinical trial simulation
  • Epidemiology

The data

  • Public data bases
  • Proprietary data bases
  • NEW data
slide-15
SLIDE 15
  • !

)

  • Drug & Disease Model Resource (DDMoRe)

vision and deliverables

slide-16
SLIDE 16