
SLIDE 1
COIC ALTERNATIVES ANALYSIS
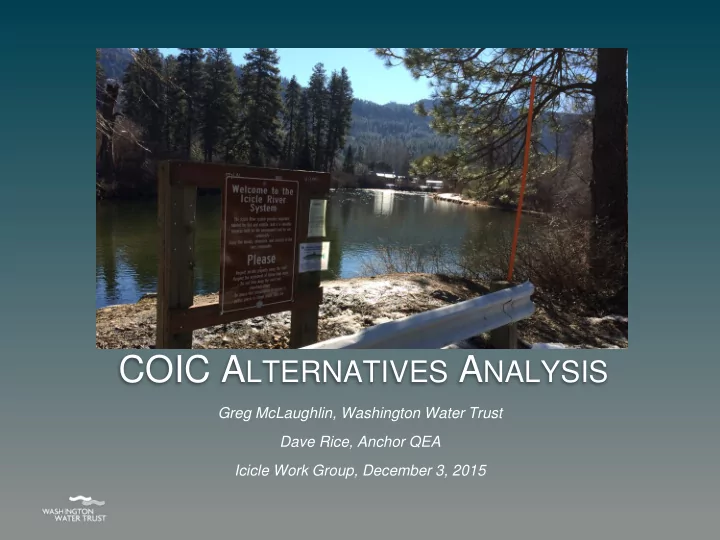
Greg McLaughlin, Washington Water Trust Dave Rice, Anchor QEA Icicle Work Group, December 3, 2015
COIC A LTERNATIVES A NALYSIS Greg McLaughlin, Washington Water Trust - - PowerPoint PPT Presentation
COIC A LTERNATIVES A NALYSIS Greg McLaughlin, Washington Water Trust Dave Rice, Anchor QEA Icicle Work Group, December 3, 2015 Purpose of Alternatives Analysis This analysis aims to identify opportunities and constraints of alternatives for
Greg McLaughlin, Washington Water Trust Dave Rice, Anchor QEA Icicle Work Group, December 3, 2015
In October of 2014, COIC and WWT signed an MOA to evaluate conservation alternatives and complete a review of water rights. The intent was to:
rights information to COIC
alternatives that would enhance flows in lower Icicle Creek
construction costs for each alternative
administrative benefits of replacing the COIC diversion on Icicle Creek with a pumped
efficiency of the COIC delivery system
Alt. Description Water Supply Delivery System
1 Replace existing system with a pressurized,
to Icicle Creek. A pump station on the Wenatchee River or on Icicle Creek near Shore Street. Pressurized delivery pipeline in alignment of existing ditch and existing laterals. 2 Add additional capacity to Alternative 1 for
for LNFH. 12-24 cfs benefit to Icicle Creek. Same as Alternative 1. Same as Alternative 1, but sized to 12-24 cfs. 3 Improve existing infrastructure by piping or lining to improve efficiency. .5 – 2 cfs benefit to Icicle Creek. Maintain operation
diversion. Replace existing open ditch with gravity pipelines or line existing ditch. Existing laterals to remain. 4 Evaluate consumptive use and identify
savings via water user conservation. Could be combined with Alternative 1, 2, or 3. Could be combined with Alternative 1, 2, or 3.
Item 4 cfs Capacity 6 cfs Capacity 8 cfs Capacity Pumping Station Design Flow 4cfs 6 cfs 8 cfs Pumping, TDH 183 feet 188 feet 192 feet Main Line Sizing 6-inch to 15-inch 6-inch to 15-inch 6-inch to 18-inch Main Line Pressures 20 psi to 73 psi 20 psi to 76 psi 20 psi to 77 psi Lateral Sizing 6-inch to 8-inch 6-inch to 8-inch 8-inch to 10-inch Lateral Pressures 31 psi to 64 psi 30 psi to 65 psi 34 psi to 67 psi
Item 12 cfs Capacity 24 cfs Capacity Pumping Station Design Flow 12 cfs 24 cfs Pumping, TDH 180 feet 180 feet Main Line Sizing 6-inch to 21-inch 6-inch to 30-inch Main Line Pressures 20 psi to 72 psi 20 psi to 72 psi Lateral Sizing 6-inch to 21-inch 8-inch to 30-inch Lateral Pressures 31 psi to 62 psi 34 psi to 62 psi
Team 1 Team 2 Location Flow Total Gain/Loss Total Gain/Loss Flow Gain/Loss Gain/Loss Top Weir
5.61
0.02 0.3%
Wilkinson
5.35 0.26 4.6% 6.15 0.32 4.9%
Shore Street
5.36 0.25 4.5%
Open Ditch
4.80 0.81 16.9% 4.57 1.90 29.4%
1 Staff from Washington Water Trust/Washington Department of Fish and Wildlife 2 Staff from Chelan County Natural Resources Department 3 Represents water loss measured from Top Weir to measurement location. 4 The loss measured below Shore Street was largely due to ditch overtopping
Alternative 1 Item 4-cfs 6-cfs 8-cfs Site and Preparation Work $109,000 $104,000 $104,000 Pressurized Delivery Pipelines $697,000 $774,000 $878,000 Gravity Delivery Pipelines $0 $0 $0 Ditch Lining $0 $0 $0 River Pump Station $431,000 $569,000 $673,000 Subtotal – Construction Cost $1,237,000 $1,447,000 $1,655,000 Mobilization/Demobilization (10%) $123,700 $144,700 $165,500 Sales Tax (8.2%) $101,434 $118,654 $135,710 Total Construction Cost2 $1.68M – $1.90M $1.97M – $2.22 M $2.25M - $2.54M Total Non-construction Costs2, 3 $386K – $430K $443K - $495K $505K - $564K Total Project Implementation Cost2 $2.07M – $2.33M $2.41M - $2.72M $2.75M – $3.11M
Notes: 1 Costs are in 2015 dollars. 2 The high end of the range of Total Construction/Non-Construction with 30% contingency. 3 The low end of the range includes a 15% construction contingency. 4 Non-construction costs include an allowance for engineering, permitting, and administration
Alternative 2
Item 12-cfs 24-cfs Site and Preparation Work $104,000 $104,000 Pressurized Delivery Pipelines $1,074,000 $1,470,000 Gravity Delivery Pipelines $0 $0 Ditch Lining $0 $0 River Pump Station $882,000 $1,472,000 Subtotal – Construction Cost $2,060,000 $3,046,000 Mobilization/Demobilization (10%) $206,000 $304,600 Sales Tax (8.2%) $168,920 $249,772 Total Construction Cost2 $2.80M - $3.17M $4.14M - $4.68M Total Non-construction Costs2, 3 $620K - $693K $898K - $1.01M Total Project Implementation Cost2 $3.42M - $3.86M $5.04m - $5.69M
Notes: 1 Costs are in 2015 dollars. 2 The high end of the range of Total Construction/Non-Construction with 30% contingency. 3 The low end of the range includes a 15% construction contingency. 4 Non-construction costs include an allowance for engineering, permitting, and administration
Alternative 1
Notes: O&M = operations and maintenance 1 Costs shown are in 2015 dollars. Long-term cost analysis assumes that costs will increase with inflation. 2 Pumping power costs are based on Chelan County PUD Rate Schedule 5 for Irrigation Service. 3 The annual replacement fund cost represents the deposit required during the first year of funding to fund replacement of 25% of all pipe and infrastructure during a 50-year design life cycle and 100% of pumps and electrical equipment during a 25-year design life cycle. 4 This is a fund designed to cover all operating costs with interest and grow at the estimated rate of inflation.
Notes: O&M = operations and maintenance 1 Costs shown are in 2015 dollars. Long-term cost analysis assumes that costs will increase with inflation. 2 Pumping power costs are based on Chelan County PUD Rate Schedule 5 for Irrigation Service. 3 The annual replacement fund cost represents the deposit required during the first year of funding to fund replacement of 25% of all pipe and infrastructure and all pumps/electrical during a 50-year design life cycle and 100% of pumps and electrical equipment during a 25-year design life cycle. 4 This is a fund designed to cover all operating costs with interest and grow at the estimated rate of inflation.
Notes: O&M = operations and maintenance 1 Costs shown are in 2015 dollars. Long-term cost analysis assumes that costs will increase with inflation. 2 Pumping power costs are based on Chelan County PUD Rate Schedule 5 for Irrigation Service. 3 The annual replacement fund cost represents the deposit required during the first year of funding to fund replacement of 25% of all pipe and infrastructure and all pumps/electrical during a 50-year design life. 4 This is a fund designed to cover all operating costs with interest and grow at the estimated rate of inflation.
greg@washingtonwatertrust.org 509.925.5601
Western WA Office
1530 Westlake Ave N, Ste 400 Seattle, WA 98109 206.675.1585
Eastern WA Office
103 East 4th Ave, Ste 203 Ellensburg, WA 98926 509.925.5601