Cluster Computing: Cluster Computing: You've Come A Long Way - - PDF document

cluster computing cluster computing you ve come a long
SMART_READER_LITE
LIVE PREVIEW

Cluster Computing: Cluster Computing: You've Come A Long Way - - PDF document

LCSC 5th Annual Workshop on Linux Clusters for Super Computing October 18-21, 2004 Linkping University, Sweden Cluster Computing: Cluster Computing: You've Come A Long Way You've Come A Long Way In A Short Time In A Short Time Jack


slide-1
SLIDE 1

1

1

Cluster Computing: Cluster Computing: You've Come A Long Way You've Come A Long Way In A Short Time In A Short Time

Jack Dongarra University of Tennessee and Oak Ridge National Laboratory

LCSC 5th Annual Workshop on Linux Clusters for Super Computing October 18-21, 2004 Linköping University, Sweden

2

Vibrant Field for High Performance Vibrant Field for High Performance Computers Computers

♦ Cray X1 ♦ SGI Altix ♦ IBM Regatta ♦ IBM Blue Gene/L ♦ IBM eServer ♦ Sun ♦ HP ♦ Bull NovaScale ♦ Fujitsu PrimePower ♦ Hitachi SR11000 ♦ NEC SX-7 ♦ Apple

♦ Coming soon …

Cray RedStorm Cray BlackWidow NEC SX-8

slide-2
SLIDE 2

2

3

  • H. Meuer, H. Simon, E. Strohmaier, & JD
  • H. Meuer, H. Simon, E. Strohmaier, & JD
  • Listing of the 500 most powerful

Computers in the World

  • Yardstick: Rmax from LINPACK MPP

Ax=b, dense problem

  • Updated twice a year

SC‘xy in the States in November Meeting in Heidelberg, Germany in June

  • All data available from www.top500.org

Size Rate

TPP performance

4

Architecture/Systems Continuum Architecture/Systems Continuum

Custom processor with custom interconnect

  • Cray X1
  • NEC SX-7
  • IBM Regatta
  • IBM Blue Gene/L

Commodity processor with custom interconnect

  • SGI Altix

Intel Itanium 2

  • Cray Red Storm

AMD Opteron

Commodity processor with commodity interconnect

  • Clusters

Pentium, Itanium, Opteron, Alpha GigE, Infiniband, Myrinet, Quadrics

  • NEC TX7
  • IBM eServer
  • Bull NovaScale 5160

Loosely Coupled Tightly Coupled

0% 20% 40% 60% 80% 100% J u n -9 3 D e c -9 3 J u n -9 4 D e c -9 4 J u n -9 5 D e c -9 5 J u n -9 6 D e c -9 6 J u n -9 7 D e c -9 7 J u n -9 8 D e c -9 8 J u n -9 9 D e c -9 9 J u n -0 0 D e c -0 0 J u n -0 1 D e c -0 1 J u n -0 2 D e c -0 2 J u n -0 3 D e c -0 3 J u n -0 4

Custom Commod Hybrid

slide-3
SLIDE 3

3

5

I t is really difficult to tell when an exponential is happening… by the time you get enough data points, it is too late

Larry Smarr

6

Top500 Performance by Manufacturer June 2004

IBM 51% HP 19% SGI 3% Sun 1% Fujitsu 2% Hitachi 1% Self-made 2% Dell 3% NEC 6% Cray Inc. 2% California Digital Corp. 2% Intel 0% Linux Networx 3% Others 5%

slide-4
SLIDE 4

4

7

The Golden Age of HPC Linux The Golden Age of HPC Linux

♦ The adoption rate of Linux HPC is phenomenal!

Linux in the Top500 is (was) doubling every 12 months Linux adoption is not driven by bottom feeders

Adoption is actually faster at the ultra-scale!

♦ Most supercomputers run Linux ♦ Adoption rate driven by several factors:

Linux is stable: Often the default platform for CS research Essentially no barrier to entry Effort to learn programming paradigm, libs, devl env., and tools preserved across many orders of magnitude Stable, complete, portable, middleware software stacks:

MPICH, MPI-IO, PVFS, PBS, math libraries, etc

8

Commodity Processors Commodity Processors

♦ Intel Pentium Xeon

3.2 GHz, peak = 6.4 Gflop/s Linpack 100 = 1.7 Gflop/s Linpack 1000 = 3.1 Gflop/s

♦ AMD Opteron

2.2 GHz, peak = 4.4 Gflop/s Linpack 100 = 1.3 Gflop/s Linpack 1000 = 3.1 Gflop/s

♦ Intel Itanium 2

1.5 GHz, peak = 6 Gflop/s Linpack 100 = 1.7 Gflop/s Linpack 1000 = 5.4 Gflop/s

♦ HP PA RISC ♦ Sun UltraSPARC IV ♦ HP Alpha EV68

1.25 GHz, 2.5 Gflop/s peak

♦ MIPS R16000

slide-5
SLIDE 5

5

9

♦ Gig Ethernet ♦ Myrinet ♦ Infiniband ♦ QsNet ♦ SCI

Clos F a t t r e e T

  • r

u s

Commodity Interconnects Commodity Interconnects

Cost Cost Cost MPI Lat / 1-way / Bi-Dir Switch topology NIC Sw/node Node (us) / MB/s / MB/s Gigabit Ethernet Bus $ 50 $ 50 $ 100 30 / 100 / 150 SCI Torus $1,600 $ 0 $1,600 5 / 300 / 400 QsNetII (R) Fat Tree $1,200 $1,700 $2,900 3 / 880 / 900 QsNetII (E) Fat Tree $1,000 $ 700 $1,700 3 / 880 / 900 Myrinet (D card) Clos $ 595 $ 400 $ 995 6.5 / 240 / 480 Myrinet (E card) Clos $ 995 $ 400 $1,395 6 / 450 / 900 IB 4x Fat Tree $1,000 $ 400 $1,400 6 / 820 / 790 10

How Big Is Big? How Big Is Big?

♦ Every 10X brings new challenges 64 processors was once considered large

it hasn’t been “large” for quite a while

1024 processors is today’s “medium” size 2048-8096 processors is today’s “large”

we’re struggling even here

♦ 100K processor systems are in construction we have fundamental challenges … … and no integrated research program

slide-6
SLIDE 6

6

11

On the Horizon: 10K CPU SGI Columbia @NASA 10K CPU Cray Red Storm @Sandia 130K CPU IBM BG/L@LLNL

First 10,000 CPU Linux Cluster Makes Top500

12 Chip (2 processors) Compute Card (2 chips, 2x1x1) 4 processors Node Card (32 chips, 4x4x2) 16 Compute Cards 64 processors System (64 racks, 64x32x32) 131,072 procs Rack (32 Node boards, 8x8x16) 2048 processors 2.8/5.6 GF/s 4 MB (cache) 5.6/11.2 GF/s 1 GB DDR 90/180 GF/s 16 GB DDR 2.9/5.7 TF/s 0.5 TB DDR 180/360 TF/s 32 TB DDR

IBM IBM BlueGene BlueGene/L /L

“Fastest Computer” BG/L 700 MHz 16K proc 8 racks Peak: 45.9 Tflop/s Linpack: 36.0 Tflop/s

78% of peak BlueGene/L Compute ASIC

Full system total of 131,072 processors

slide-7
SLIDE 7

7

13

BlueGene/L Interconnection Networks BlueGene/L Interconnection Networks

3 Dimensional Torus

  • Interconnects all compute nodes (65,536)
  • Virtual cut-through hardware routing
  • 1.4Gb/s on all 12 node links (2.1 GB/s per node)
  • 1 µs latency between nearest neighbors, 5 µs to the

farthest

  • 4 µs latency for one hop with MPI, 10 µs to the

farthest

  • Communications backbone for computations
  • 0.7/1.4 TB/s bisection bandwidth, 68TB/s total

bandwidth Global Tree

  • Interconnects all compute and I/O nodes (1024)
  • One-to-all broadcast functionality
  • Reduction operations functionality
  • 2.8 Gb/s of bandwidth per link
  • Latency of one way tree traversal 2.5 µs
  • ~23TB/s total binary tree bandwidth (64k machine)

Ethernet

  • Incorporated into every node ASIC
  • Active in the I/O nodes (1:64)
  • All external comm. (file I/O, control, user

interaction, etc.) Low Latency Global Barrier and Interrupt

  • Latency of round trip 1.3 µs

Control Network 14

OS for IBM OS for IBM’ ’s BG/L s BG/L

♦ Service Node:

Linux SuSE SLES 8

♦ Front End Nodes:

Linux SuSE SLES 9

♦ I/O Nodes:

An embedded Linux

♦ Compute Nodes:

Home-brew OS

♦ Trend:

Extremely large systems run an “OS Suite” Functional Decomposition trend lends itself toward a customized, optimized point-solution OS Hierarchical Organization requires software to manage topology, call forwarding, and collective operations

Vector Pipeline Vector Pipeline Vector Pipeline Vector Pipeline

Smart Memory

Message Processor

I/O Node

slide-8
SLIDE 8

8

15

Sandia Sandia National Lab National Lab’ ’s Red Storm s Red Storm

  • Red Storm is a supercomputer system leveraging over 10,000 AMD

Opteron™ processors connected by an innovative high speed, high bandwidth 3D mesh interconnect designed by Cray.

  • Cray was awarded $93M to build the Red Storm system to support

the Department of Energy's Nuclear stockpile stewardship program for advanced 3D modeling and simulation.

  • Scientists at Sandia National Lab helped with the architectural

design of the Red Storm supercomputer.

16

  • 40TF peak performance
  • 108 compute node cabinets, 16 service and I/O node cabinets, and 16

Red/Black switch cabinets – 10,368 compute processors - 2.0 GHz AMD Opteron™ – 512 service and I/O processors (256P for red, 256P for black) – 10 TB DDR memory

  • 240 TB of disk storage(120TB for red, 120TB for black)
  • MPP System Software

– Linux + lightweight compute node operating system – Managed and used as a single system – Easy to use programming environment – Common programming environment – High performance file system – Low overhead RAS and message passing

  • Approximately 3,000 ft² including

disk systems

Red Storm System Overview Red Storm System Overview

slide-9
SLIDE 9

9

17

DOE DOE -

  • Lawrence Livermore National Lab

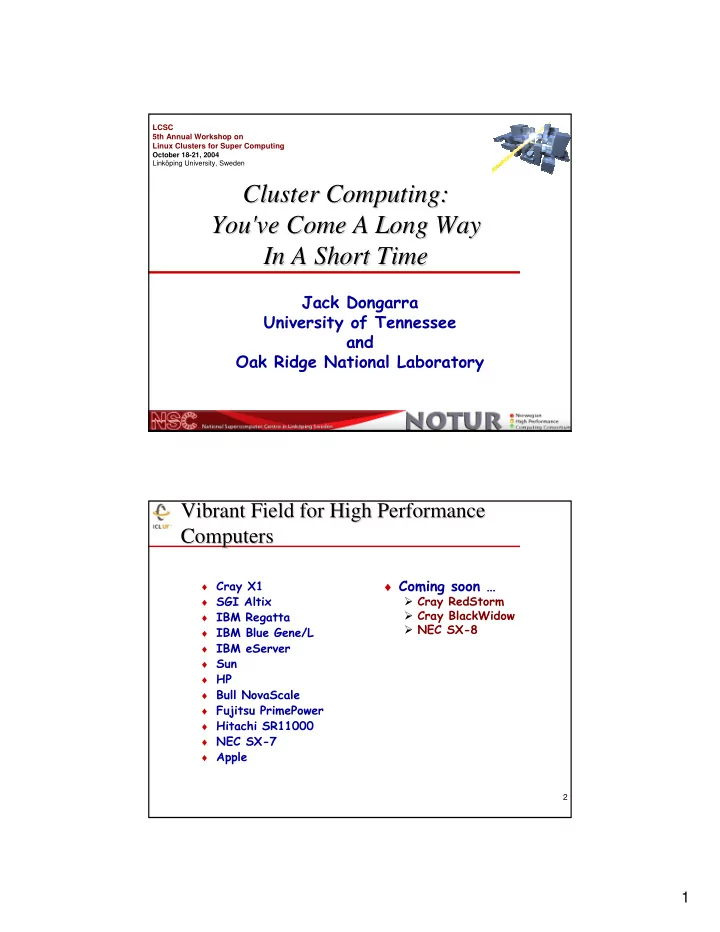
Lawrence Livermore National Lab’ ’s Itanium 2 Based s Itanium 2 Based Thunder System Architecture Thunder System Architecture 1,024 nodes, 4096 processors, 23 1,024 nodes, 4096 processors, 23 TFlop/s TFlop/s peak peak

System Parameters

  • Quad 1.4 GHz Itanium2 Madison Tiger4 nodes with 8.0 GB DDR266 SDRAM
  • <3 µs, 900 MB/s MPI latency and Bandwidth over QsNet Elan4
  • Support 400 MB/s transfers to Archive over quad Jumbo Frame Gb-Enet and

QSW links from each Login node

  • 75 TB in local disk in 73 GB/node UltraSCSI320 disk
  • 50 MB/s POSIX serial I/O to any file system
  • 8.7 B:F = 192 TB global parallel file system in multiple RAID5
  • Lustre file system with 6.4 GB/s delivered parallel I/O performance
  • MPI I/O based performance with a large sweet spot
  • 32 < MPI tasks < 4,096
  • Software RHEL 3.0, CHAOS, SLURM/DPCS, MPICH2, TotalView, Intel and

GNU Fortran, C and C++ compilers Contracts with

  • California Digital Corp for nodes and integration
  • Quadrics for Elan4
  • Data Direct Networks for global file system
  • Cluster File System for Lustre support

Contracts with

  • California Digital Corp for nodes and integration
  • Quadrics for Elan4
  • Data Direct Networks for global file system
  • Cluster File System for Lustre support

OST OST OST OST OST OST OST OST OST OST OST OST OST OST OST OST

QsNet Elan3, 100BaseT Control 1,002 Tiger4 Compute Nodes 4 Login nodes with 6 Gb-Enet

2 Service 32 Object Storage Targets 200 MB/s delivered each Lustre Total 6.4 GB/s 2 MetaData (fail-over) Servers 16 Gateway nodes @ 400 MB/s delivered Lustre I/O over 4x1GbE

100BaseT Management

MDS MDS GW GW GW GW GW GW GW GW

1,024 Port (16x64D64U+8x64D64U) QsNet Elan4

GbEnet Federated Switch

4096 processor 19.9 TFlop/s Linpack 87% peak

18

High Bandwidth High Bandwidth vs vs Commodity Systems Commodity Systems

♦ High bandwidth systems have traditionally been vector

computers

Designed for scientific problems Capability computing ♦ Commodity processors are designed for web servers and the

home PC market

(should be thankful that the manufactures keep the 64 bit fl pt) Used for cluster based computers leveraging price point ♦ Scientific computing needs are different Require a better balance between data movement and floating point operations. Results in greater efficiency.

Eart rth Si h Simulator Cray ray X1 X1 ASCI Q Q MCR Apple X e Xserv erve (NEC) (Cr Cray) (HP E EV68) Xeo eon IB IBM P PowerPC Year Year o

  • f I

Introduction 2002 2003 2002 2002 20 2003 03 Node A Archi chitecture re Vect ctor

  • r

Vect ctor

  • r

Alph pha Pent ntium Po Power PC r PC Processor C Cycle T Time 50 500 MH 0 MHz 800 00 MH MHz 1.25 G 5 GHz 2.4 GH GHz 2 GH 2 GHz Peak Spe Speed pe d per P Proce

  • cessor

8 G Gflop/s 12.8 G Gflop/ p/s 2.5 G Gflop/

  • p/s

4.8 G Gflop/s 8 Gfl 8 Gflop/s Operan ands/Flop(mai main memo memory) 0.5 0.33 0.1 0.0 .055 0. 0.063

System Balance - MEMORY BANDWIDTH

slide-10
SLIDE 10

10

19

System Balance (Network) System Balance (Network)

Network Speed (MB/s) vs Node speed (flop/s)

2.00 1.60 1.20 1.00 0.38 0.02 0.08 0.05 0.18 0.13

0.00 0.50 1.00 1.50 2.00 2.50 Cray X1 Cray Red Storm ASCI Red Cray T3E/1200 Blue Gene/L ASCI Blue Mountain ASCI White LANL Pink PSC Lemieux ASCI Purple

Communication/Computation Balance (Bytes/Flop) (Higher is better) 20

The Top242 The Top242

♦ Focus on machines that

are > 1 TFlop/s on the Linpack benchmark

♦ Linpack Based

Pros

One number Simple to define and rank Allows problem size to change with machine and

  • ver time

Cons

Emphasizes only “peak” CPU speed and number of CPUs Does not stress local bandwidth Does not stress the network Does not test gather/scatter Ignores Amdahl’s Law (Only does weak scaling) …

1993:

#1 = 59.7 GFlop/s #500 = 422 MFlop/s ♦

2004:

#1 = 35.8 TFlop/s #500 = 813 GFlop/s 1 Tflop/s

slide-11
SLIDE 11

11

21

Number of Systems on Top500 > 1 Number of Systems on Top500 > 1 Tflop/s Tflop/s Over Time Over Time

50 100 150 200 250 Nov-96 May-97 Nov-97 May-98 Nov-98 May-99 Nov-99 May-00 Nov-00 May-01 Nov-01 May-02 Nov-02 May-03 Nov-03 May-04 Nov-04

22

Factoids on Machines > 1 Factoids on Machines > 1 TFlop/s TFlop/s

242 Systems

171 Clusters (71%)

Average rate: 2.54 Tflop/s

Median rate: 1.72 Tflop/s

Sum of processors in Top242: 238,449

Sum for Top500: 318,846 ♦

Average processor count: 985

Median processor count: 565

Numbers of processors

Most number of processors: 963261

ASCI Red

Fewest number of processors: 124152

Cray X1

Year of Introduction for 242 Systems > 1 TFlop/s

1 3 2 6 29 82 119 20 40 60 80 100 120 140 1998 1999 2000 2001 2002 2003 2004

Number of Processors 100 1000 10000 50 100 150 200 Rank Number of Processors

slide-12
SLIDE 12

12

23

Percent Of 242 Systems Which Use The Percent Of 242 Systems Which Use The Following Processors > 1 Following Processors > 1 TFlop/s TFlop/s

More than half are based on 32 bit architecture 11 Machines have a Vector instruction Sets

Pentium, 137, 58% Itanium, 22, 9% Cray, 5, 2% AMD, 13, 5% IBM, 46, 19% Alpha, 8, 3% NEC, 6, 2% SGI, 1, 0% Sparc, 4, 2%

150 26 11 9 8 7 6 5 3 222 21 1 11 11 1 1 1 IBM Hewlett-Packard SGI Linux Networx Dell Cray Inc. NEC Self-made Fujitsu Angstrom Microsystems Hitachi lenovo Promicro/Quadrics Atipa Technology Bull SA California Digital Corporation Dawning Exadron HPTi Intel RackSaver Visual Technology

24

Breakdown by Sector

industry 40% classified 2% academic 22% vendor 4% research 32% government 0%

Percent Breakdown by Classes Percent Breakdown by Classes

Custom Processor w/ Commodity Interconnect 13 5% Custom Processor w/ Custom Interconnect 57 24% Commodity Processor w/ Commodity Interconnect 172 71%

slide-13
SLIDE 13

13

25

What About Efficiency? What About Efficiency?

♦ Talking about Linpack ♦ What should be the efficiency of a machine

  • n the Top242 be?

Percent of peak for Linpack > 90% ? > 80% ? > 70% ? > 60% ? … ♦ Remember this is O(n3) ops and O(n2) data Mostly matrix multiply

Efficiency of Systems > 1 Tflop/s

0.1 0.2 0.3 0.4 0.5 0.6 0.7 0.8 0.9 1 40 80 120 160 200 240 Efficiency Alpha Cray Itanium IBM SGI NEC AMD Pentium Sparc

ES LLNL Tiger ASCI Q IBM BG/L NCSA ECMWF RIKEN IBM BG/L PNNL Dawning

Top10

Rmax 10 0 0 10 0 0 0 10 0 0 0 0 5 0 10 0 15 0 2 0 0

Rank

slide-14
SLIDE 14

14

27

Efficiency of Systems > 1 Tflop/s

0.1 0.2 0.3 0.4 0.5 0.6 0.7 0.8 0.9 1 40 80 120 160 200 240 Rank Efficiency GigE Infiniband Myrinet Proprietary Quadrics SCI

Rmax 10 0 0 10 0 0 0 10 0 0 0 0 5 0 10 0 15 0 2 0 0

ES LLNL Tiger ASCI Q IBM BG/L NCSA ECMWF RIKEN IBM BG/L PNNL Dawning

Rank

Top10 Myricom, 49 Infiniband, 4 SCI, 2 GigE, 100 Proprietary, 71 Quadrics, 16

Interconnects Used in the Top242 Interconnects Used in the Top242

Largest node count min max average GigE 1128 17% 64% 51% SCI 400 64% 74% 68% QsNetII 4096 66% 88% 75% Myrinet 1408 44% 79% 64% Infiniband 768 59% 78% 75% Proprietary 9632 45% 99% 68%

Efficiency for Linpack Efficiency for Linpack

slide-15
SLIDE 15

15

29

Country Percent by Total Performance Country Percent by Total Performance

United States 60% Finland 0% India 0% Taiwan 0% Japan 12% United Kingdom 7% Germany 4% China 4% Korea, South 1% France 2% Canada 2% Mexico 1% Switzerland 0% Singapore 0% Saudia Arabia 0% Malaysia 0% Israel 1% New Zealand 1% Sweden 1% Netherlands 1% Brazil 1% Australia 0% Italy 1%

940.2 1152 Integrity Superdome, 1.5 GHz, HPlex 192 HP Ericsson S weden/ 2004 263 1132 1760 Pentium Xeon Cluster 2.2 GHz - SCI 3D 400 S elf-made National S upercomputer Centre (NS C) S weden/ 2002 198 1321.76 2154.24 xSeries Xeon 3.06 GHz - Gig-E 352 IBM Evergrow Grid S weden/ 2004 166 1329 1689.6 HP Opteron 2.2 GHz, Myrinet 384 HP Umea University / HPC2N S weden/ 2004 165 Rmax Rpeak Computer / Processors Manufacturer Site Country/Year Rank

30

KFlop/s KFlop/s per Capita (Flops/Pop) per Capita (Flops/Pop)

200 400 600 800 1000 1200 1400 I n d i a C h i n a B r a z i l M a l a y s i a M e x i c

  • S

a u d i a A r a b i a T a i w a n I t a l y A u s t r a l i a S w i t z e r l a n d K

  • r

e a , S

  • u

t h N e t h e r l a n d s F i n l a n d F r a n c e S i n g a p

  • r

e G e r m a n y C a n a d a S w e d e n J a p a n U n i t e d K i n g d

  • m

I s r a e l N e w Z e a l a n d U n i t e d S t a t e s

WETA Digital (Lord of the Rings)

slide-16
SLIDE 16

16

31 ♦

Google query attributes

150M queries/day (2000/second) 100 countries 4.2B documents in the index

60 Data centers

100,000 Linux systems in data centers around the world

15 TFlop/s and 1000 TB total capability 40-80 1U/2U servers/cabinet 100 MB Ethernet switches/cabinet with gigabit Ethernet uplink

growth from 4,000 systems (June 2000)

18M queries then

Performance and operation simple reissue of failed commands to new servers no performance debugging

  • problems are not reproducible

Source: Monika Henzinger, Google & Cleve Moler

Forward link are referred to in the rows Back links are referred to in the columns

Eigenvalue problem; Ax = λx n=4.2x10⁹ (see: MathWorks Cleve’s Corner)

The matrix is the transition probability matrix of the Markov chain; Ax = x

32

Sony PlayStation2 Sony PlayStation2

♦ Emotion Engine: ♦ 6 Gflop/s peak ♦ Superscalar MIPS 300 MHz

core + vector coprocessor + graphics/DRAM

About $200 70M sold

♦ 8K D cache; 32 MB memory not

expandable OS goes here as well

♦ 32 bit fl pt; not IEEE ♦ 2.4GB/s to memory (.38 B/Flop) ♦ Potential 20 fl pt ops/cycle FPU w/FMAC+FDIV VPU1 w/4FMAC+FDIV VPU2 w/4FMAC+FDIV EFU w/FMAC+FDIV

slide-17
SLIDE 17

17

33

Computing On Toys Computing On Toys

♦ Sony PlayStation2

6.2 GF peak 70M polygons/second 10.5M transistors superscalar RISC core plus vector units, each: 19 mul-adds & 1 divide each 7 cycles

♦ $199 retail

loss leader for game sales

♦ 100 unit cluster at U of I

Linux software and vector unit use

  • ver 0.5 TF peak

but hard to program & hard to extract performance …

34

Petascale Systems In 2008 Petascale Systems In 2008

♦ Technology trends

multicore processors

IBM Power4 and SUN UltraSPARC IV Itanium “Montecito” in 2005 quad-core and beyond are coming

reduced power consumption

laptop and mobile market drivers

increased I/O and memory interconnect integration

PCI Express, Infiniband, …

♦ Let’s look forward a few years to 2008

8-way or 16-way cores (8 or 16 processors/chip) ~10 GF cores (processors) and 4-way nodes (4, 8-way cores/node) 12x Infiniband-like interconnect

♦ With 10 GF processors 100K processors and 3100 nodes (4-way with 8 cores each) 1-3 MW of power, at a minimum

slide-18
SLIDE 18

18

35

Software Evolution and Faults Software Evolution and Faults

♦ Cost dynamics

people costs are rising hardware costs are falling

♦ Two divergent software world views

parallel systems

life is good – deus ex machina

Internet

evil everywhere, trust no one, we’ll all die horribly

♦ What does this mean for software?

abandon the pre-industrial “craftsman model” adopt an “automated evolution” model

36

Fault Tolerance: Motivation Fault Tolerance: Motivation

♦ Trends in HPC:

High end systems with thousand of processors

♦ Increased probability of a node failure

Most systems nowadays are robust

♦ MPI widely accepted in scientific computing

Process faults not tolerated in MPI model

Mismatch between hardware and (non fault- tolerant) programming paradigm of MPI.

slide-19
SLIDE 19

19

37

Fault Tolerance in the Computation Fault Tolerance in the Computation

♦ Some next generation systems

are being designed with 100K processors (IBM Blue Gene L)

♦ MTTF 105 - 106 hours for

component

sounds like a lot until you divide by 105! Failures for such a system is likely to be just a few hours perhaps minutes away. ♦ Application checkpoint /restart

is today’s typical fault tolerance method.

♦ Problem with MPI, no recovery

from faults in the standard

♦ Many cluster based on

commodity parts don’t have error correcting primary memory

♦ Caches are not SECDED

38

Real Crisis With HPC Is With The Real Crisis With HPC Is With The Software Software

♦ Programming is stuck

Arguably hasn’t changed since the 70’s

♦ It’s time for a change

Complexity is rising dramatically

highly parallel and distributed systems

From 10 to 100 to 1000 to 10000 to 100000 of processors!!

multidisciplinary applications

♦ A supercomputer application and software are usually

much more long-lived than a hardware

Hardware life typically five years at most. Fortran and C are the main programming models

♦ Software is a major cost component of modern

technologies.

The tradition in HPC system procurement is to assume that the software is free.

slide-20
SLIDE 20

20

39

Motivation Self Adapting Motivation Self Adapting Numerical Software (SANS) Effort Numerical Software (SANS) Effort

♦ Optimizing software to exploit the features of a

given system has historically been an exercise in hand customization. Time consuming and tedious Hard to predict performance from source code Must be redone for every architecture and compiler Software technology often lags architecture Best algorithm may depend on input, so some tuning may be needed at run-time. ♦ There is a need for quick/dynamic deployment

  • f optimized routines.

40

Performance Tuning Methodology Performance Tuning Methodology

Input Parameters System specifics Hardware Probe Parameter study

  • f code versions

Code Generation Performance database User options Installation

Software Installation

(done once per system)

Parameter study of the hw

Generate multiple versions of code, w/difference values of key performance parameters

Run and measure the performance for various versions

Pick best and generate library

Optimize over 8 parameters

  • Cache blocking
  • Register blocking (2)
  • FP unit latency
  • Memory fetch
  • Interleaving loads & computation
  • Loop unrolling
  • Loop overhead minimization

Similar to FFTW Software Generation Software Generation Strategy Strategy -

  • ATLAS BLAS

ATLAS BLAS

slide-21
SLIDE 21

21

41

Self Adapting Numerical Software Self Adapting Numerical Software -

  • SANS Effort

SANS Effort

♦ Provide software technology to aid in high performance on

commodity processors, clusters, and grids.

♦ Pre-run time (library building stage) and run time

  • ptimization.

♦ Integrated performance modeling and analysis ♦ Automatic algorithm selection – polyalgorithmic functions ♦ Automated installation process ♦ Can be expanded to areas such as communication software

and selection of numerical algorithms

TUNING SYSTEM Different SW segment Size msgs “Best” SW segment Block msgs

42

Generic Code Optimization Generic Code Optimization

♦ Follow on to ATLAS Take generic code segments and perform

  • ptimizations via experiments

♦ Collaboration with ROSE project (source-

to-source code transformation /

  • ptimization) at Lawrence Livermore

National Laboratory

Daniel Quinlan and Qing Yi LoopProcessor -bk3 4 -unroll 4 ./dgemv.c We generate the test cases and also the timing driver. ♦ Also collaboration with Jim Demmel and

Kathy Yelick at Berkeley under an NSF ITR effort.

slide-22
SLIDE 22

22

43

Some Current Unmet Needs Some Current Unmet Needs

♦ Performance / Portability ♦ Fault tolerance ♦ Better programming models

Global shared address space Visible locality

♦ Maybe coming soon (incremental, yet offering real

benefits):

Global Address Space (GAS) languages: UPC, Co-Array Fortran, Titanium)

“Minor” extensions to existing languages More convenient than MPI Have performance transparency via explicit remote memory references

♦ The critical cycle of prototyping, assessment, and

commercialization must be a long-term, sustaining investment, not a one time, crash program.

44

Collaborators / Support Collaborators / Support

Slides are online:

Google “dongarra” Click on “talks”

♦ Top500 Team Erich Strohmaier, NERSC Hans Meuer, Mannheim Horst Simon, NERSC