
SLIDE 1
Cluster Analysis Objective: Group data points into classes of similar - - PowerPoint PPT Presentation
Multivariate Fundamentals: Distance Cluster Analysis Objective: Group data points into classes of similar points based on a series of variables Useful to find the true groups that are assumed to really exist, BUT if the analysis generates
Alfred Louis Kroeber (1876-1961)
A B C D … A 1.8 0.6 3.0 B 1.8 2.5 3.3 C 0.6 2.5 2.2 D 3.0 3.3 2.2 … 1.8 0.6 2.5 3.3 2.2 3.0
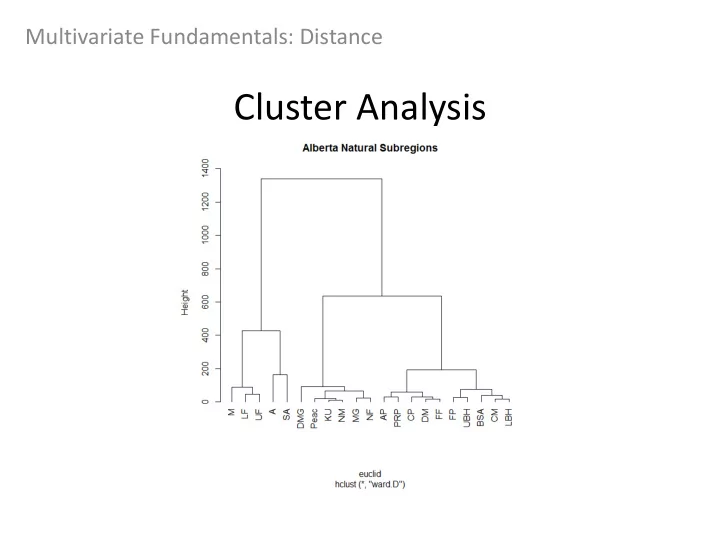
Ordination – visualizes the information in the distance calculations If distances are not equal between points we can draw a “hanging tree” to illustrate distances
4 2 1 3
distance The result of a cluster analysis is a tree or dendrogram
In effect we keep asking data matrix “Which plot is my nearest neighbour?” to add branches
First creates a group based on small distance then uses the centroid of that group to find which additional points belong in the same group
Looks for spherical clusters The process starts with all points in individual clusters (bottom up) and the process repeatedly merges a pair of clusters such that when merged there is a minimum increase in total within-cluster variance This process continues until a single group including all points (the top of the tree) is defined
CA in R:
hclust(distMatrix,method) (stats package)
" ward.D" = Ward’s minimum variance method " ward.D2" = Ward’s minimum variance method – however dissimilarities are squared before clustering "single" = Nearest neighbours method "complete" = distance between two clusters is defined as the maximum distance between an observation in one cluster and an observation in the other cluster "average" = distance between two clusters is defined as the mean distance between an observation in one cluster and an observation in the other cluster "mcquitty " = when two clusters are be joined, the distance of the new cluster to any other cluster is calculated as the average of the distances of the soon to be joined clusters to that other cluster "median" = uses group median "centroid" = uses group centroid
We create distance matrices in Lab 5
From the output plot we can compare the groups cluster analysis has generated Each collection of branches could be considered a group It is up to you to decide how far down the tree you want to specify your groups We want small distances and groups that logically make sense