Climate Change Presentation Teacher Notes by Ruben Meerman This - - PDF document

climate change presentation
SMART_READER_LITE
LIVE PREVIEW

Climate Change Presentation Teacher Notes by Ruben Meerman This - - PDF document

Climate Change Presentation Teacher Notes by Ruben Meerman This presentation is based on published, peer reviewed literature and the Fourth Assessment Report by the Intergovernmental Panel on Climate Change (IPCC, 2007). Other useful links are


slide-1
SLIDE 1

CLIMATE CHANGE PRESENTATION – Teacher Notes 1 ¡

Climate Change Presentation

Teacher Notes by Ruben Meerman

This presentation is based on published, peer reviewed literature and the Fourth Assessment Report by the Intergovernmental Panel on Climate Change (IPCC, 2007). Other useful links are provided at the end of these notes. The IPCC’s fourth report and the individual contributions of the three working groups can be downloaded in PDF format at:

www.ipcc.ch

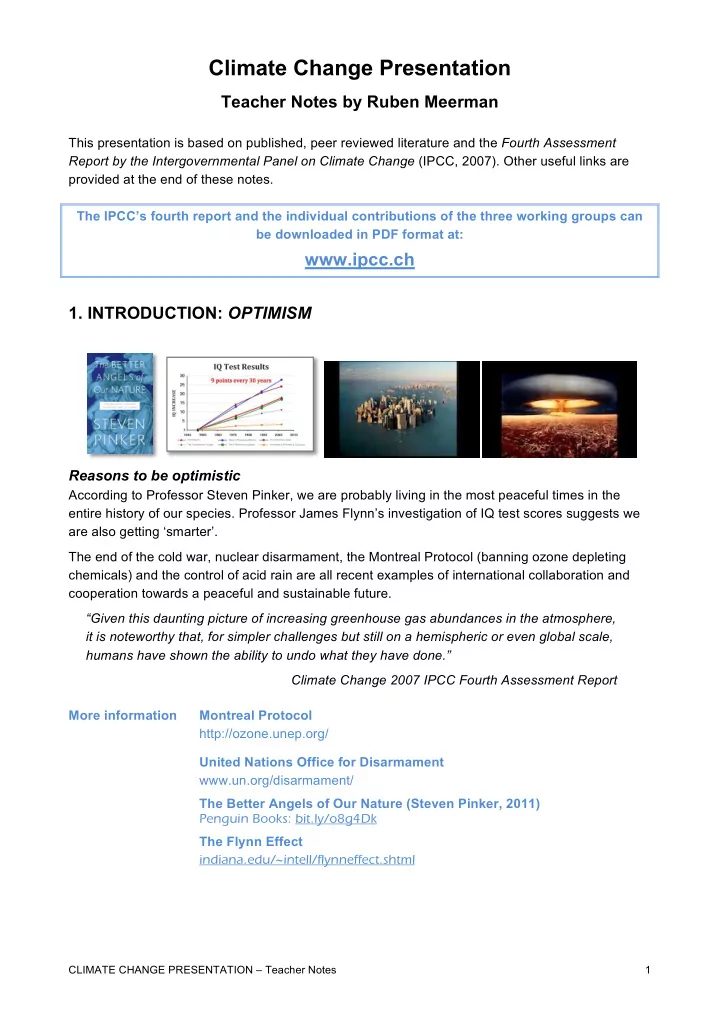
  • 1. INTRODUCTION: OPTIMISM

Reasons to be optimistic

According to Professor Steven Pinker, we are probably living in the most peaceful times in the entire history of our species. Professor James Flynn’s investigation of IQ test scores suggests we are also getting ‘smarter’. The end of the cold war, nuclear disarmament, the Montreal Protocol (banning ozone depleting chemicals) and the control of acid rain are all recent examples of international collaboration and cooperation towards a peaceful and sustainable future. “Given this daunting picture of increasing greenhouse gas abundances in the atmosphere, it is noteworthy that, for simpler challenges but still on a hemispheric or even global scale, humans have shown the ability to undo what they have done.” Climate Change 2007 IPCC Fourth Assessment Report More information Montreal Protocol http://ozone.unep.org/ United Nations Office for Disarmament www.un.org/disarmament/ The Better Angels of Our Nature (Steven Pinker, 2011) Penguin Books: bit.ly/o8g4Dk The Flynn Effect indiana.edu/~intell/flynneffect.shtml

slide-2
SLIDE 2

CLIMATE CHANGE PRESENTATION – Teacher Notes 2 ¡

  • 2. THE EARTH FROM SPACE

The Blue Marble (photo taken from Apollo 17, 1972)

This image is called the Blue Marble> It is the only photograph of Earth taken by a human being from space with the sun directly behind the camera. The original image, its history and more photos are available at NASA’s Earth Observatory website.

http://earthobservatory.nasa.gov/Features/BlueMarble/ Composite of 3 Weeks of Satellite Data (animation)

The latest animation of the three most recent weeks of satellite images is available from the University of Winsconsin-Madison’s Space Science and Engineering Centre (updated every three hours).

www.ssec.wisc.edu/data/composites.html

  • 3. WHY EARTH HAS WEATHER

This demonstration and accompanying slides are intended to provide a brief, basic introduction to the forces that drive and shape the Earth’s complex weather systems.

DEMONSTRATION 1: Balloon in liquid nitrogen A balloon cooled with liquid nitrogen (– 1960C) shrinks and expands again upon return to room temperature. This thermal expansion of air (as it warms and cools in response to the Sun’s heat) is the driving force behind all the Earth’s weather.

slide-3
SLIDE 3

CLIMATE CHANGE PRESENTATION – Teacher Notes 3 ¡

Simple expansion of air demo without liquid nitrogen

To demonstrate the thermal expansion of air without liquid nitrogen; stretch balloon

  • ver the neck of a clear, empty bottle and submerge in hot, then cold water. The

balloon will partially inflate and deflate:

www.abc.net.au/science/surfingscientist/pdf/teachdemo_8.pdf DEMONSTRATION 2: Liquid nitrogen V Boiling Water

Liquid nitrogen is poured into boiling hot water to demonstrate the rapid condensation of water vapour. Warmer air can hold more water vapour and thus, on average, produces less cloud cover. Cooler air can hold less water vapour and thus, on average, produces more cloud cover. The warming of the atmosphere can therefore invoke a dangerous positive feedback – warmer air = less clouds = more sunlight reaching earth = even warmer air = even less clouds = even warmer air… etc.

Hadley Cells, Coriolis Force and Jet Streams

The Earth is roughly spherical (it is an oblate spheroid), the intensity of solar radiation per square metre is greater at the equator than the poles. This differential heating, combined with the Earth’s rotation, results in atmospheric circulation on a global scale. The trade winds result from the Coriolis Force acting on the equatorial-bound surface winds of the Hadley Cells. The westerlies result from the Coriolis Force acting on the pole-ward surface winds of the Ferrel Cells. The four easterly jet streams of the upper troposphere form at the boundaries of the Hadley, Ferrel and Polar Cells. The Australian Bureau of Meteorology website provides a good introduction and more information about atmospheric circulation:

http://www.bom.gov.au/info/ftweather/page_4.shtml

  • 4. THE GREENHOUSE EFFECT & INFRARED LIGHT

These slides provide a basic introduction to the impact of carbon dioxide emissions from human activities on the greenhouse effect. The greenhouse effect is good

The greenhouse effect was ‘discovered’ in the 1800s by Joseph Fourier, John Tyndall and Svante

  • Arrhenius. Without the greenhouse effect, the Earth’s average global temperature would be around

–190C. Greenhouse gases absorb the outgoing infrared radiation that would otherwise escape back to space, and re-radiate it back down to Earth, keeping the global average temperature at 14-

  • 150C. The enhanced greenhouse effect (EGHE) is the additional heat-trapping due to greenhouse

gases from human activities.

¡

slide-4
SLIDE 4

CLIMATE CHANGE PRESENTATION – Teacher Notes 4 ¡

DEMONSTRATION 3: Seeing Infrared

A mobile phone’s camera can demonstrate that infrared light is invisible to the human eye. www.abc.net.au/science/articles/2010/10/18/3041198.htm

  • 5. THERMOHALINE CIRCULATION

The Earth’s thermohaline circulation transports heat, dissolved gases and nutrients and provides the overturning necessary for life to flourish in the deep ocean. Its role in the Earth’s carbon cycle is a vital component of climate change.

Thermohaline Circulation and ARGO Floats

The thermohaline circulation, often referred to as the Earth’s great conveyor belt, stabilises the Earth’s climate and delivers oxygen to the deep ocean. It is driven by differences in seawater density, which varies with temperature and salinity (thermo = temperature, haline = salinity). When seawater water freezes, salt is ‘squeezed’ out resulting in slightly less saline ice and slightly more saline below. The slightly more saline water sinks below the forming ice sheet and spreads along

  • cean floor forming a slow but massive current. Evaporation at the surface also increases the

salinity, and therefore density of seawater. These variations in salinity and temperature combined with the prevailing surface winds, rotation and topology of the Earth form the thermohaline circulation. An army of more than 3000 robotic devices called Argo floats now monitor the world’s oceans salinity, temperature and currents. The ARGO global position animation can be downloaded from the Goddard Space Flight Centre’s Scientific Visualisation Studio website.

http://svs.gsfc.nasa.gov/vis/a000000/a003200/a003205/index.html

More information “Argo” Catalyst report (ABC Television) www.abc.net.au/catalyst/stories/2501110.htm Argo Website www.argo.ucsd.edu

ARGO ¡Float ¡Global ¡Positions ¡ NASA ¡Animation ¡ ¡

slide-5
SLIDE 5

CLIMATE CHANGE PRESENTATION – Teacher Notes 5 ¡

  • 5. THE KEELING CURVE

This iconic graph has become the symbol of climate change and is the longest continuous plot of atmospheric carbon dioxide concentration measured at Mauna Loa Observatory (Hawaii), which began in 1958.

The Keeling Curve (1958 – present)

As a young PhD student, Charles David Keeling (1928 – 2005) made two remarkable discoveries: 1) the seasonal “breathing” of the planet as plants lose their leaves and grow new ones, and 2) the rise of atmospheric CO2 due to human activities. The ‘Keeling Curve’ can be downloaded at:

http://scrippsco2.ucsd.edu/graphics_gallery/mauna_loa_record.html The “Breathing” Earth Animation

This animation is available at the NASA website below. Right click the Low resolution file (31Mb – Quicktime) and select “Save as…”

www.nasa.gov/mission_pages/oco/multimedia/anim-keeling.html More Information Keeling’s original paper titled “Concentration and Isotopic Abundances

  • f Carbon Dioxide in the Atmosphere”, published in Tellus (Vol. 12,
  • No. 2), can be downloaded from the Scripps Institution of

Oceanography website:

http://scrippsco2.ucsd.edu/publications/keeling_tellus_1960.pdf

  • 6. THE IMPACT OF RISING CO2

Scientists agree that the rising CO2 observed since the 1700s is due to human activity (mainly the burning of fossil fuels, cement production and land clearing) and that global surface temperatures are rising as a result. Four independent sets of records analysed by NASA, the Met Office (UK), NOAA (USA) and the Japanese Meteorological Agency all show approximately 1.0OC warming since the 1800s.

slide-6
SLIDE 6

CLIMATE CHANGE PRESENTATION – Teacher Notes 6 ¡

  • 7. DEMONSTRATION 2: WHAT IS AIR?

Clear balloon in liquid nitrogen

This demonstration is performed if time permits. Condensed liquid oxygen and solid carbon dioxide (dry ice) become clearly visible inside a transparent balloon cooled with liquid nitrogen.

  • 8. THE EARTH’S CLIMATE HISTORY

Two Atlantic ice core records from Vostok and Dome C (EPICA) years reveal current atmospheric carbon dioxide concentrations (390ppm) are now the higher than they have been for at least 650,000 years.

The Ice Core Record

Concentrations of carbon dioxide, methane and nitrous oxide have been measured in bubbles of air trapped between snowflakes dating back more than 650,000. The abundance of deuterium (‘heavy hydrogen’ atoms that contain a neutron) in the same ice provides an accurate proxy for the global temperature at the time the snowflakes were deposited. The ration of oxygen isotopes in ice and sediment cores provides a proxy for the amount of global ice on land. The original graph published by the IPCC in 2007 can be downloaded from URL below.

www.ipcc.ch/graphics/ar4-wg1/jpg/fig-6-3.jpg Milankovitch Cycles and Ice Ages

The inter-glacial (warm) periods are initiated by changes in the Earth’s orbit (eccentricity, tilt and precession). The change in solar insolation due to these orbital changes does not appear to be sufficient to raise global temperature alone. The subsequent release of carbon dioxide from the

  • ceans, among other climate feedbacks, accounts for the sudden onsets of the observed inter-

glacials in the ice core records.

slide-7
SLIDE 7

CLIMATE CHANGE PRESENTATION – Teacher Notes 7 ¡

  • 9. EVIDENCE and OPINION / EXPERTS and AMATUERS?

The scientific, peer-reviewed publishing process helps to distinguish experts from amateurs and separate the evidence from opinions.

Skeptic arguments versus published evidence: one example

Some climate change skeptics mistakenly believe that the greenhouse potential of carbon dioxide was saturated before the pre-industrial era. This misconception can be traced back to John Tyndall’s discovery of carbon dioxide’s role in the greenhouse effect. At current concentrations and atmospheric pressure, CO2’s ability to absorb infrared light is indeed saturated but this is not so at the lower pressures of the upper atmosphere. Satellite measurements between 1970 and 2003 provide direct evidence that the outgoing infrared radiation at carbon dioxide’s absorption wavelengths is decreasing.

REFERENCE: Comparison of spectrally resolved outgoing longwave data between 1970 and present. (2004)

  • J. A. Griggs & J. E. Harries, Proceedings of the International Society for Optics and Photonics, SPIE 5543,

164

Experts versus non-experts

In 2009, the National Academy of Sciences of the United States of America reviewed the peer- reviewed literature on climate change and found that: “(i) 97–98% of the climate researchers most actively publishing in the field support the tenets

  • f ACC outlined by the Intergovernmental Panel on Climate Change, and

(ii) the relative climate expertise and scientific prominence of the researchers unconvinced

  • f ACC are substantially below that of the convinced researchers.”

REFERENCE: W.R.L. Anderegg, J.W. Prall, J.C., & S. H. Schneider (2010) Expert credibility in climate change Proceedings of the National Academy of Sciences of the United States of America Vol. 107 No. 27. Download the full article in PDF format at: http://www.pnas.org/content/107/27/12107.full.pdf+html

Consensus among scientists

Some climate change skeptics argue that there is little or no consensus among scientists about anthropogenic climate change. One line of evidence for the lack of agreement presented by skeptics is known as The Petition Project, signed by more than 31,000 US scientists. There are several problems with this petition: 1) any person with a science qualification (not just climate scientists) was deemed eligible for the petition 2) in 2008, 10.6 million American citizens had a science qualification so the petition only represents 0.3% of the total number of US ‘scientist’ 3) petitions are not a form of scientific evidence.

slide-8
SLIDE 8

CLIMATE CHANGE PRESENTATION – Teacher Notes 8 ¡

All of the world’s national science academies (including eg the Australian Academy of Science, the Royal Institution) and nearly all the world’s professional and government scientific organizations and agencies (including eg CSIRO, Australian Institute of Physics) have published and signed statements of agreement with the basic tenets of anthropogenic climate change (ACC). A comprehensive list of signatories can be found at:

http://en.wikipedia.org/wiki/Scientific_opinion_on_climate_change

  • 10. STAYING POSITIVE

The IPCC’s ‘worst case scenario’ predicts a CO2 concentration of 1130ppm by 2100AD which could raise global temperatures by as much as 8OC. There are many reasons to remain optimistic – this slide presents some of the technologies that may help prevent the worst case outcomes expected from a ‘business as usual’ response to climate change.

How can we prevent it?

Many experts argue that we already have all the technology required to reduce emissions and avoid major, rapid climate change. These include solar, wind, geothermal and wave energy and a shift toward more sustainable lifestyles. Several other potential carbon-free energy sources could solve all the world’s energy problems including nuclear fusion and biological production of hydrogen Carbon sequestration is a promising technology that, if perfected and eventually adopted, could eventually reduce carbon emission from coal fired power stations to zero. The IPCC report on carbon capture and storage can be downloaded at:

http://www.ipcc.ch/pdf/special-reports/srccs/srccs_wholereport.pdf

  • 11. WHAT CAN YOU DO RIGHT NOW?

These slides demonstrate some of the simple ways we can all live more sustainably e.g. recycle, compost food scraps, avoid bottled water, use public transport, cut down your electricity usage.

slide-9
SLIDE 9

CLIMATE CHANGE PRESENTATION – Teacher Notes 9 ¡

  • 11. DEMONSTRATION 3: OCEAN ACIDIFICATION

Global warming has an evil twin: ocean acidification is happening due to absorption of atmospheric carbonic dioxide by seawater.

Carbonic acid demonstration

Phenolphthalein is used to demonstrate the effect of dissolved carbon dioxide on the pH of water. A few drops of lime water (slaked lime) are added to the water to increase the pH sufficiently for a visible change to occur when the student volunteer exhales through the solution.

DIY version of the demonstration and short Catalyst video

A DIY version students can do at home (with aquarium pH indicator instead of phenolphthalein) and a video about ocean acidification by ABC TV’s Catalyst are available at the URL below.

http://www.abc.net.au/science/articles/2011/02/24/3147423.htm Ocean chemistry

Seawater is slightly alkaline with an average pH of around 8.2 ±0.3 (it varies seasonally and geographically). When carbon dioxide dissolves in water, it forms carbonic acid (H2CO3). Carbonic acid rapidly splits into a hydrogen and bicarbonate ion (H2CO3 ⇒ H+ + HCO3

  • ). The hydrogen ions

released convert carbonate ions (CO3

2-) in seawater to bicarbonate (HCO3

  • ), resulting in a smaller

change in the pH than would be expected (in the absence of carbonate ions). This ‘carbonate buffer’, maintains the pH of seawater within a narrow range. The ocean’s pH has already decreased by 0.1 units since the pre-industrial era. While this figure sounds small, it represents a 30% increase in the concentration of hydrogen ions. Scientists predict the ocean’s pH will reach 7.3 by the year 2100, based on the ‘business as usual’ emissions scenario.

Potential impacts

Organisms that build calcium carbonate shells depend on carbonate ions as a raw material. With the predicted decrease in carbonate ion concentrations, these organisms will struggle to build their shells and grow normally. Corals, phytoplankton and some algae also require the presence of carbonate ions. These organisms all play a vital role in transporting carbon to the deep ocean waters and sediments when they die, a process referred to as a ‘biological pump’.

REFERENCE: Ocean acidification due to increasing atmospheric carbon dioxide The Royal Society (2005) http://royalsociety.org/Ocean-acidification-due-to-increasing-atmospheric-carbon-dioxide/

slide-10
SLIDE 10

CLIMATE CHANGE PRESENTATION – Teacher Notes 10 ¡

  • 12. SOME USEFUL LINKS

Australian Academy of Science: The Science of Climate Change: Questions and Answers. www.science.org.au/policy/climatechange.html?source=cmailer Skeptical Science: “Getting sceptical about global warming scepticism” A very useful website listing the most common arguments against climate change with references and links to peer-reviewed, published research. www.skepticalscience.com/ Refuting The Great Global Warming Swindle television program What two of CSIRO scientists said about the television program, The Great Global Warming Swindle, which aired on ABC TV, Australia on 12 July 2007. www.csiro.au/news/Refuting-The-Great-Global-Warming-Swindle-television-program.html FREE ONLINE VIDEOS Crude – the incredible journey of oil This award-winning documentary by Richard Smith is essential viewing for anyone interested in climate change, ‘peak oil’ or the future of our planet. www.abc.net.au/science/crude/ ABC TV – CATALYST STORIES “Climate Change” (7 minutes) www.abc.net.au/catalyst/stories/3013512.htm “Snowball Earth” (8 minutes) www.abc.net.au/catalyst/stories/2377133.htm “Ocean Acidification” (9 minutes) www.abc.net.au/catalyst/stories/s2029333.htm “Turtles” (7 minutes) www.abc.net.au/catalyst/stories/2544848.htm