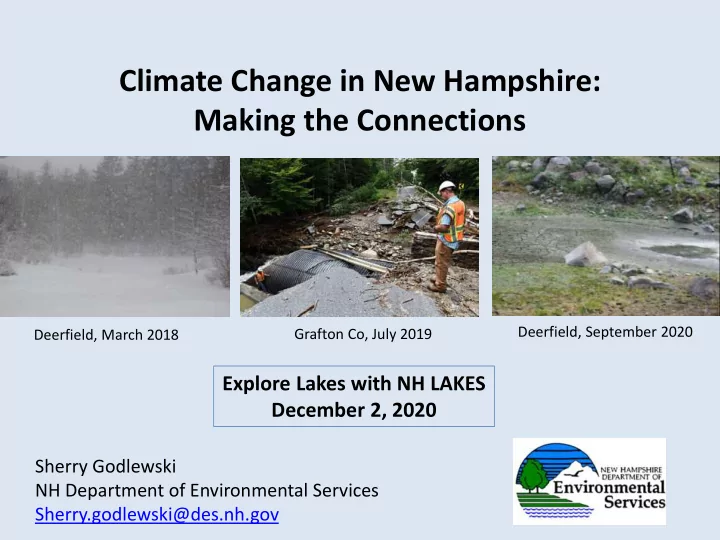
SLIDE 1 Climate Change in New Hampshire: Making the Connections
Sherry Godlewski NH Department of Environmental Services Sherry.godlewski@des.nh.gov
Deerfield, March 2018 Grafton Co, July 2019 Deerfield, September 2020
Explore Lakes with NH LAKES December 2, 2020
SLIDE 2 $ 45 Billion
2019 marks the fifth consecutive year (2015-19) in which 10 or more separate billion-dollar disaster events have impacted the U.S.
https://www.ncdc.noaa.gov/billions/
SLIDE 3
– 15 Disaster Declarations – 3 Emergency Declarations
– 21 Disaster Declarations
- Hurricane
- Tropical Storm
- Severe Storms
–Fall Snow Storm –Flooding events
- Winter Storms
- Landslide
- Tornado
– 10 Emergency Declarations
Axe Handle Brook, Rochester, NH, May 2006
NH Presidentially-Declared Extreme Weather Events
Source: FEMA.gov
SLIDE 4 $- $5.00 $10.00 $15.00 $20.00 $25.00 $30.00 $35.00 1986 1987 1990 1991 1993 1995 1996 1998 1999 2001 2003 2005 2006 2007 2008 2010 2011 2012 2013 2015 2017
Federal Reimbursement for Extreme Weather in NH
(millions $ 2017)
1998: Ice Storm 2005: Alstead/Keene Floods (Oct) 2006: Mother’s Day Flood (May) 2007: Patriots Day Flood (April) 2008: Tornado; Floods; Ice Storm 2010: Windstorm; Floods 2011: Irene 2012: Sandy; Flooding 2013: Severe Winter Storm; Landslide; Flooding 2015: Severe Winter Storm 2017: Severe Winter Storm; Severe Storm; Flooding
SLIDE 5 Higher than average temperatures Lower than average snowfall
2020 January Weather
Sunday, January 12 Portland broke it's daily max temp record at 52 (old record 51 in 2014) and Concord did the same at 67 (old record 61 in 1885!)
National Weather Service
SLIDE 6
January 2020 was the planet's warmest January since record keeping began in 1880
SLIDE 7 20oC (68oF)
Feb 9, 2020
https://www.theguardian.com/world/2020/feb/13/antarctic-temperature-rises-above-20c-first-time-record
Pine Island Glacier 120 square miles
SLIDE 8
January – June
Much above average temperatures Below average precipitation
SLIDE 9 Summer Heat
- Increasing days over 90 degrees are
happening, but more significantly…
- Nighttime temps are increasing at a
faster rate
temperatures have increased by 2.5 degrees F (statistically significant)
- Reducing night time cooling can have
serious health effects
- Concord had it 4th hottest summer on
record with 25 days above 90o
- Manchester had 32 days above 90o
usually less than 10 (since 1980)
- Smothering summer humidity in the
Northeast has crushed records
- Not going to change – will continue to
move in this warmer than average direction
Acuweather | NOAA
SLIDE 10
https://www.climatecentral.org/
SLIDE 11
The Northern Hemisphere had the warmest summer on record
SLIDE 12
Verkhoyansk Detail area Moscow RUSSIA 400 MILES Norilsk Arctic Ocean Yakutsk SIBERIA Srednekolymsk Russkoye Ustye RUSSIA
Verkhoyansk 100.4 degrees June 20, 2020 Highest temperature in the Arctic since record keeping began in 1885 Arctic is warming 3x as fast as the rest of the world 400 miles farther north than Anchorage, AK Warmer than Dallas or Houston
Washington Post/NASA
SLIDE 13
SLIDE 14 September 15, 2020 was the second lowest in the 42-year satellite record The 14 lowest extents in the satellite era have all occurred in the last 14 years
Climate Central + National Snow and Ice Data Center + Yale.edu
By the end of October, 2020 Arctic Sea Ice had Still Not Formed in Siberia — the Latest Date on Record
SLIDE 15 Western Wildfires and Air Quality
Acuweather AirNow.gov
Scotts Mills, OR Sept 15, 2020
“Smoke from Western Wildfires leading to hazy skies, vibrant sunsets over NH”
WMUR Sept 15, 2020
SLIDE 16 Wildfires in White Mountains
“The fire had burned two feet down into the ground… no soil moisture”
Fire Chief Steven Sherman
Wildfires in NH
Merrimack River Island Fire Burns Out of Control in Concord (Sept 22) Sept 26 - Governor issued a proclamation that bans both outdoor burning and smoking in and near New Hampshire woodlands statewide due to the extremely high danger of wildfires 207 fires, ~ 83 acres
SLIDE 17
Drought
DES Raises Risk Of Multi-Year Drought As NH Heads Toward Winter
SLIDE 18
SLIDE 19
- 30 named storms in 2020, second only
to 2005's 28 storms.
- 13 hurricanes, 6 major hurricanes
- 12 named storms, including six hurricanes, have
made landfall in the U.S. this season
- Unusually active October and November
- Latest Category 5 storm, Iota, ever (Nov 16)
- Warm ocean and sea surface temperatures
- Warming planet
weather.com
Hurricanes
SLIDE 20 More CO2 = More Extreme Weather
Scientists now link extreme weather events to carbon dioxide in the air from the burning of fossil fuels. More atmospheric CO2 has boosted the odds of extreme heat, extreme cold, drought, + punishing rain/snow storms….
The National Academies Press. 2016 https://doi.org/10.17226/21852
SLIDE 21 The National Academies Press. 2016 https://doi.org/10.17226/21852
…we can now estimate how climate change increases the risk to society
- f some types of extreme events
A new pattern of more frequent and more intense weather events…. new area of science called ‘Event Attribution’
SLIDE 22 Kevin A. Reed, Stony Brook University Alyssa M. Stansfield, Stony Brook University Michael F. Wehner, Lawrence Berkeley National Laboratory Colin M. Zarzycki, National Center for Atmospheric Research Center for Climate and Energy Solutions November 2018 webinar
SLIDE 23
Weather – the set of conditions at any given point in time
– today, tomorrow, this week
Climate - the average set of conditions over a period of decades
– 30 year averages
Weather and Climate
SLIDE 24
- Over the past 50 years, the average global temperature
has increased at the fastest rate in recorded history.
- Burning of fossil fuels to for transportation is the largest source of
heat-trapping pollution. Second is electricity generation (2016)
SLIDE 25 Global Warming Causes the Climate to Change
- Greenhouse gases trap heat
– Warming of our atmosphere causes warmer
– Changes to water cycle (some more rain, some less rain) – Warms oceans, Melts glaciers, Sea-level Rise – Effects plant growth
– Raised atmospheric carbon dioxide levels from 280 parts per million to 411 parts per million in the last 150 years
SLIDE 26 Measuring Carbon Dioxide
- Ice cores
- Ambient Monitoring
– Mauna Loa collecting data since 1956
SLIDE 27 Petit et al., 1999
180 220 260 300 100,000 200,000 300,000 400,000
Carbon Dioxide (ppmv) Years before 2000 AD CO 2
411 ppm
Atmospheric Carbon Dioxide Record
Industrial Revolution
SLIDE 28 Petit et al., 1999
180 220 260 300 100,000 200,000 300,000 400,000
5
Carbon Dioxide (ppmv) Years before 2000 AD Temperature (
CO 2 Temperature
411 ppm
Atmospheric Carbon Dioxide & Temperature Record
SLIDE 29
SLIDE 30 Source: R. Barry & R. Chorley (2009). Atmosphere, Weather and Climate.
Wobbly Jet Stream
SLIDE 31
January 20-29, 2019 Polar Vortex
SLIDE 32 The Changing Jet Stream
- The jet stream exhibits extreme behavior
- During the summer, warm air holds more moisture + when
stirred by a hurricane, the moisture manifests as intense rainfall
- Same phenomena as the polar vortex in winter
- Predicted to increase by 50 % this century if emissions of
carbon dioxide + other GHG continue unchecked
Michael Mann, climate scientist at Pennsylvania State University
SLIDE 33 Potsdam Institute for Climate Impact Research April 11, 2018 Gulf of Maine Research Institute
The oceans’ circulation hasn’t been this sluggish in 1,000 years The ocean circulation has declined in strength by 15% since the mid-20th century This is a new record low Over the past 15 years the Gulf of Maine has warmed 7 times faster than the rest
Gulf Stream Weakening
SLIDE 34 Seacoast Southern NH Northern NH
http://sustainableunh.unh.edu/csne-climate-assessments-new-england#map
Local Data!
Local and Regional Climate Assessments
SLIDE 35 Observed Climate Patterns and How This Impacts Us
- Increase in precipitation – rain + snow
– Amount + intensity
- Increase in average temperature
- Increase in extreme weather
- Changing seasonality
- Drought
- Sea-level rise
– Portsmouth’s sea level has risen 6” since 1926 – Weekly high tide flooding in Hampton – Increases in ground water levels
CSNE 2014 & Knott 2017
SLIDE 36
from 1958 to 2012 https://nca2014.globalchange.gov/report/regions/northeast
SLIDE 37
SLIDE 38
Drought 2016
SLIDE 39
Portsmouth, NH Hampton, NH King Tide
Sea-Level Rise
SLIDE 40
99% of climate scientists agree that climate-warming trends are likely due to human activity
Climate Change is Real
SLIDE 41 The impacts of climate change are already being felt by communities across the country These extreme events (heat, cold, storms, drought) are disrupting and damaging critical infrastructure, labor/economies, natural resources, and the vitality
National Climate Assessment 2018
Climate Change is Already Occurring
SLIDE 42
Do nothing – Continue with business as usual
We Have a Choice
SLIDE 43
– Reduce emissions of CO2 +
- ther greenhouse gases
- Reduce our use of fossil fuels
- Adaptation
– Prepare for the current and future impacts
We Have a Choice
SLIDE 44
SLIDE 45 Average number of days over 90 degrees per year
Climate Change in Southern/Northern NH – CSNE https://sustainableunh.unh.edu/csne-climate-assessments-new-england
Extreme Heat
north of 43.75oN south of 43.9oN Overlap of 0.15o ~17 miles
SLIDE 46 The growing season is projected to lengthen by about two weeks (lower emission scenario)
- r five weeks (higher emission scenario)
Hotter temperatures, reduced chilling hours, enhanced evapotranspiration, and more extreme precipitation will likely result in a decrease in crop yields.
Climate Change in Southern/Northern NH – CSNE https://sustainableunh.unh.edu/csne-climate-assessments-new-england
Future Growing Season
SLIDE 47 Annual precipitation is projected to increase 17 to 20% (both emission scenarios, both regions) by the end of the century Increase in extreme precipitation events, results in excessive runoff, flooding, damage to critical infrastructure (buildings, roads, dams, bridges, culverts), increased erosion & degradation of water quality…
Climate Change in Southern/Northern NH – CSNE https://sustainableunh.unh.edu/csne-climate-assessments-new-england
Future Precipitation
Southern Northern
SLIDE 48 Historically we had 105 [S]/140 [N]days per year with snow cover (>1” of snow) By the end of the century (high emissions scenario), we could have only 52 [S]/~100 [N]days
Climate Change in Southern/Northern NH – CSNE https://sustainableunh.unh.edu/csne-climate-assessments-new-england
Snow Covered Days
From 105 to 52 days From 140 to ~100 days
SLIDE 49
– Displaced people
- Development increases – more
pavement
- More homes built in risky areas
- Old infrastructure - undersized
- Federal funding decreases
- Politics
- Other?
Exacerbating Issues
SLIDE 50 Mitigation – reducing our fossil fuel use
- Saves money – now and into the future
- Reduces the amount we will have to adapt to
Adaptation
- Proactive adaptation—including changes to policies, business operations,
capital investments + other steps—yields benefits in excess of their costs now + into the future. $1.00 invested now saves $7.00 to recover
Need to do both!
SLIDE 51
45 years ago – Smog – Solution: Catalytic converters – Smog reduced by 30% to 50%
We Have Met Environmental Challenges in the Past!
SLIDE 52
35 years ago – Ozone layer destruction – Solution: Chlorofluorocarbon (CFC) phase out – CFCs all but eliminated, ozone layer (slowly) rebounding
We Have Met Environmental Challenges in the Past!
SLIDE 53
30 years ago – Acid Rain – Solution: market-based program for regulating utility sulfur dioxide emissions – Acid rain emissions cut by 50%; forests rebounding, lakes (slowly) recovering
We Have Met Environmental Challenges in the Past!
SLIDE 54
- Climate change will cost taxpayers more than
a half a trillion dollars this decade + trillions more in the future unless we mitigate the
- impacts. (Government Accountability Office)
- We cannot ignore the impact of climate
change on our public health, our environment + our economy.
- The lessons will continue to be taught until
they are learned.
- We’ve got to connect the dots!
Making the Connections
SLIDE 55 Working Together
- State Agencies
- Regional Workgroups
- Communities
- Conservation Groups
- Businesses
- Non-profits
- Schools
- Neighbors
- Shared voices
SLIDE 56
Thank You
Questions?
Sherry Godlewski Resilience and Adaptation Manager Sherry.Godlewski@des.nh.gov
SLIDE 57
- Flooding
- Infrastructure impacts
- Runoff + erosion
- Pollutants/bacteria/cyanobacteria
- Drought
- Lower surface water + groundwater levels
- Later “ice-in” and earlier “ice out”
- Longer growing season for invasives +
cyanobacteria
- Less recharge
- Warmer temperatures
- Changes to surface water stratification
- xygen and nutrients
- Decreased water quality
Concerns for our Lakes