
SLIDE 1
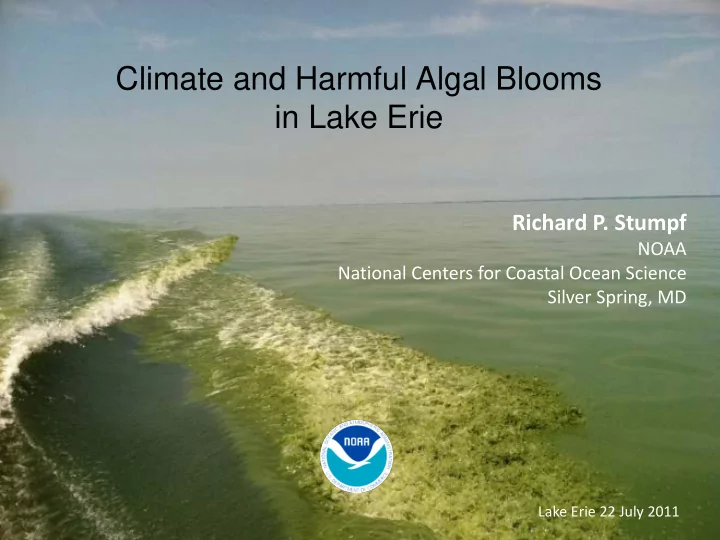
Climate and Harmful Algal Blooms in Lake Erie
Lake Erie 22 July 2011
Climate and Harmful Algal Blooms in Lake Erie Richard P. Stumpf - - PowerPoint PPT Presentation
Climate and Harmful Algal Blooms in Lake Erie Richard P. Stumpf NOAA National Centers for Coastal Ocean Science Silver Spring, MD Lake Erie 22 July 2011 2011 cyanobacteria bloom, worst in decades, visible from space 2003, perhaps the
Lake Erie 22 July 2011
2013 Nov Climate NOAA Coastal Ocean Science
2013 Nov Climate NOAA Coastal Ocean Science
2013 Nov Climate NOAA Coastal Ocean Science
105 cells ml-1 106 104
2013 Nov Climate NOAA Coastal Ocean Science
2013 Nov Climate NOAA Coastal Ocean Science
2013 Nov Climate NOAA Coastal Ocean Science
2013 Nov Climate NOAA Coastal Ocean Science
105 cells ml-1 106 104
2013 Nov Climate NOAA Coastal Ocean Science
Transports with the NOAA Great Lakes Coastal Forecast System
2013 Nov Climate NOAA Coastal Ocean Science
MODIS
WHO risk threshold
Modified from Stumpf et al., 2012 PLoSONE
2013 Nov Climate NOAA Coastal Ocean Science
CI of 1 ~ 1020 cells Microcystis
2013 Nov Climate NOAA Coastal Ocean Science
2013 Nov Climate NOAA Coastal Ocean Science
2013 Nov Climate NOAA Coastal Ocean Science
Years with small bloom Years with large bloom Stumpf et al., 2012 PLoSONE 2011
2013 Nov Climate NOAA Coastal Ocean Science
Downing et al., 2001; Can.J.Fish.Auat.Sci .
2013 Nov Climate NOAA Coastal Ocean Science
USGS Ohio Fact sheet FS-035-96)
2013 Nov Climate NOAA Coastal Ocean Science
2013 Nov Climate NOAA Coastal Ocean Science
Data from Pete Richards
2013 Nov Climate NOAA Coastal Ocean Science
Maumee River total phosphorus (m.tons) Maumee River average discharge (m3/s)
2013 Nov Climate NOAA Coastal Ocean Science
Q model (based on Q-P correlation)
Stumpf et al. 2012
Experimental SRP- Q model
2013 Nov Climate NOAA Coastal Ocean Science
2013 Nov Climate NOAA Coastal Ocean Science
2012 forecast
2013 Nov Climate NOAA Coastal Ocean Science
2013 Nov Climate NOAA Coastal Ocean Science
2013 Nov Climate NOAA Coastal Ocean Science
2013 Nov Climate NOAA Coastal Ocean Science
2013 Nov Climate NOAA Coastal Ocean Science
2013 Nov Climate NOAA Coastal Ocean Science
Maumee River total phosphorus (m.tons) Maumee River average discharge (m3/s)
average discharge based on USGS data (m3/s) dissolved phosphorus load (m.tons) total phosphorus load (m.tons) 2013 2013 2013
2013 Nov Climate NOAA Coastal Ocean Science
2013 Nov Climate NOAA Coastal Ocean Science
2013 Nov Climate NOAA Coastal Ocean Science
2013 Nov Climate NOAA Coastal Ocean Science
Assistance from NASA Decision Support, Public Health NNH08ZDA001N
Photo from Gibraltar Island, Ohio Sea Grant