City of Coronado 4 th St and Alameda Blvd Michael Baker - - PowerPoint PPT Presentation

city of coronado
SMART_READER_LITE
LIVE PREVIEW

City of Coronado 4 th St and Alameda Blvd Michael Baker - - PowerPoint PPT Presentation

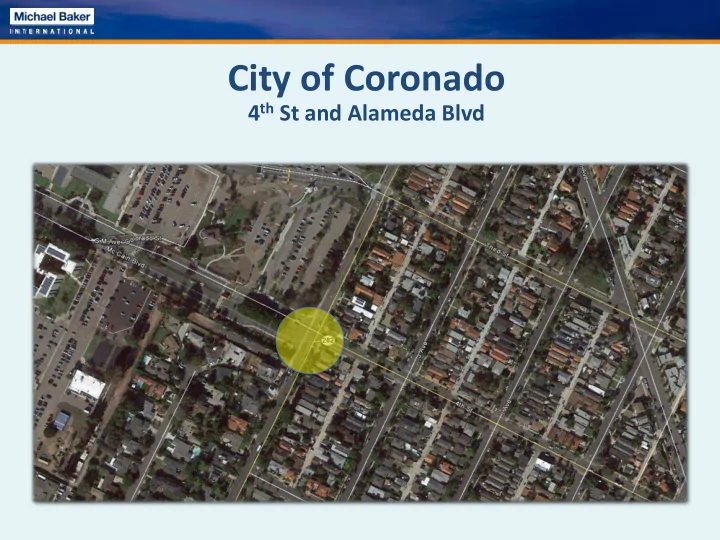
City of Coronado 4 th St and Alameda Blvd Michael Baker International Full-Service Civil Engineering Firm Public Works Department (Transportation Engineering Ryan Zellers, PE, TE Planning and Design) Registered Civil and Traffic


slide-1
SLIDE 1

City of Coronado

4th St and Alameda Blvd

slide-2
SLIDE 2

Michael Baker International

  • Full-Service Civil Engineering Firm
  • Public Works Department

(Transportation Engineering Planning and Design)

  • Registered Civil and Traffic Engineer,

19 years of experience

  • Registered Civil Engineer, 4 years of

experience

Ryan Zellers, PE, TE Blanca Soto, PE

slide-3
SLIDE 3

4th St and Alameda Blvd

(Existing All-Way Stop)

slide-4
SLIDE 4

Warrants and Operations

  • Volumes warrant a traffic signal
  • Existing All-Way stop
  • LOS = F, Delay = 58.1 sec
  • Traffic Signal, 2017 (PM Peak Hour)
  • LOS = C, Delay = 22.6 sec
  • Traffic Signal, 2030 (PM Peak Hour)
  • LOS = D, Delay = 51.5 sec
slide-5
SLIDE 5

Traffic Signal Configuration

slide-6
SLIDE 6

Traffic Signal Plan

slide-7
SLIDE 7

Traffic Signal Plan

(Enlarged)

slide-8
SLIDE 8

Traffic Signal Operations/Timing

  • Shared through-right turn lane leaving base
  • ½-street closure will be done on the Navy side
  • Traffic signal timing is a function of the controlling

jurisdiction (Caltrans)

  • Optimized based on peak traffic flows
  • Different timings for various days, times, and events
  • Video detection with adv. loops (on Navy base)
  • Coordination also controlled by Caltrans (3/4-mile

maximum for vehicle platoons)

slide-9
SLIDE 9

Queuing Results

  • Understanding 50th % and 95th % Queuing
  • 2017 Queuing Results
  • NB Alameda 50% / 95% = 86’ (4 cars) / 166’ (7 cars)
  • SB Alameda Left 50% / 95% = 154’ (6 cars) / 255’ (10 cars)
  • SB Alameda Through 50% / 95% = 101’ (4 cars) / 158’ (7 cars)
  • 2030 Queuing Results
  • NB Alameda 50% / 95% = 137' (6 cars) / 226' (9 cars)
  • SB Alameda Left 50% / 95% = 249' (10449 cars) / 449' (17 cars)
  • SB Alameda Through 50% / 95% = 135' (6 cars) / 201' (8 cars)
slide-10
SLIDE 10

Benefits and Issues

  • Platoons create downstream gaps in traffic
  • Platoon “wave” will affect all 4th Street side streets
  • Change in traffic patterns may arise, but depends on

individual driver preferences

  • Efficiency better and overall delay reduced
  • Peak traffic times could be compressed
  • Signal timing adjustments to balance side street

priority

slide-11
SLIDE 11

Decorative Signal Poles

  • Caltrans approved manufacturer
  • 10-15% increase in equipment cost
slide-12
SLIDE 12

Questions?