
SLIDE 1
CIRA/Colorado State University & *NOAA/NESDIS/STAR
1
Asia-Oceania Meteorological Satellite Users’ Conference (AOMSUC-10), Melbourne, Australia 2-6 December 2019
CIRA/ Colorado State University & * NOAA/NESDIS/STAR Asia- - - PowerPoint PPT Presentation
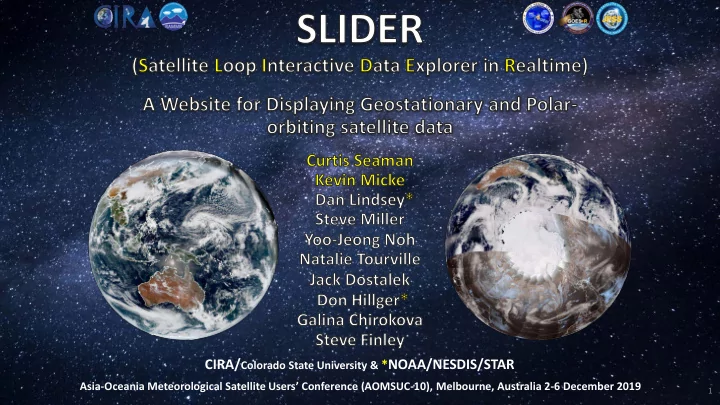
CIRA/ Colorado State University & * NOAA/NESDIS/STAR Asia- Oceania Meteorological Satellite Users Conference (AOMSUC -10), Melbourne, Australia 2-6 December 2019 1 CIRAs SLIDER Website 22 June 2017: CIRA launched SLIDER to the public
CIRA/Colorado State University & *NOAA/NESDIS/STAR
1
Asia-Oceania Meteorological Satellite Users’ Conference (AOMSUC-10), Melbourne, Australia 2-6 December 2019
http://rammb-slider.cira.colostate.edu 22 June 2017: CIRA launched SLIDER to the public SLIDER: Satellite Loop Interactive Data Explorer in Realtime This website was designed to loop GOES-R (16/17) and Himawari-8 images in realtime Imagery is displayed at varying zoom levels from the full view of the full disk (16 km), down to the full resolution of the visible channels (500 m)
2
Animated GIF
The Advanced Baseline Imager (ABI) on GOES-16/17 and the Advanced Himawari Imager (AHI) on Himawari-8/9 have similar capabilities. For these satellites, imagery is offered at 6 zoom levels ranging from 16 km (full disk view) to 0.5 km (full resolution of the 0.64 μm visible band), with full looping capability at each zoom level. Zoom in anywhere within each satellite’s field-of-view!
3
Animated GIF
4
5
6
Video card: the most important thing is a decent video card. It doesn't have to be high- end, but there are mediocre on-board ones that will struggle. A mid-level video card should be fine. RAM: 2 GB+ of RAM, and the more the better CPU: A mid-level CPU should be plenty, but if you've got dozens of browser tabs open, SLIDER will likely start to slow down Network: The faster the internet connection, the better. Under 5-10 Mbps a user will probably start to feel like it's seeming slow. The other important factor is network latency—the amount of time it takes data to get from your device to our server and back. The further away users are from Fort Collins (the other side of the planet, for instance), the longer the latency will be. A user's network is also a factor in latency, but there's often not much they can do about it. Browser: Chrome works best of all browsers, followed by Firefox. I'm not aware of any browsers where it's completely broken, as I've tried to make it as backwards-compatible as possible, though there might be some lesser-known ones that don't work. From the lead developer Kevin Micke:
Hide/show menu options Loop status bar Play loop, advance one, go back one Loop, Rock, Play loop in Reverse Adjust loop speed Zoom in one, Zoom out one, Max Zoom Toggle on/off: Map, Lat/Lon grid, “Slider” feature Satellite Menu Sector Menu Product Menu Add Overlay product menu Number of images to loop Time step between images Current product(s) displayed Toggle product on/off, adjust opacity Open Product Information dialog box Toggle on/off current or archived imagery Archived imagery select start and end date/time Open Download Options dialog box Revert to default options, create Short URL, Help Toggle on/off: Follow Feature, hide Follow vector, Clear Annotate Image with mouse, Clear annotations Remove product or overlay from display
9
Keyboard shortcuts: Look for keyboard shortcuts, which are typically given inside parentheses (). Zoom in/out: Generally speaking, it is better to right click and use the zoom level menu for zooming than it is to use the mouse scroll wheel Reduce frames: It is not always necessary to have 1 min. imagery of everything. If SLIDER performance is poor, consider increasing the timestep and reducing the number of images Patience: Try pausing the loop, and use the left and right arrow keys to advance the loop slowly to ensure all the image tiles load before looping Refresh often: If a loop takes a long time to load, or appears stuck, refresh the page. If the map appears blurry or blocky, refresh Share URL: If you check “Archived Imagery” before clicking on “Share URL”, the loop you share will be exactly the same as the loop you are viewing. If you do not, the loop you share will be updated as new imagery comes in. Animated GIFs: The longer a loop, the more likely the Download Animated GIF/PNG will
Imagemagick) to convert the images to animated GIF. Hide the menu to preview the images that will be saved.
Hybrid True Color
10
AHI has the red, green and blue visible bands necessary to make True Color images, which we improve upon using the 0.86 μm “veggie” band and a correction for Rayleigh scattering (Hybrid Atmospherically Corrected True Color). This is the daytime component of AHI GeoColor. ABI is missing the green band. CIRA has developed a method to synthesize a green band using the blue, red and “veggie” (0.86 μm) bands. ABI GeoColor is made with Synthetic Hybrid Atmospherically Corrected (SHAC) True Color. SEVIRI only has the red and veggie bands, so True Color is not available. Instead, we use the EUMETSAT “Enhanced Natural Color” RGB as the daytime component for SEVIRI
aerosol detection as evidenced by smog
Synthetic Hybrid Meteosat-8 Enhanced Natural Color Himawari-8 Hybrid True Color 04 UTC 26 Nov 2019
11
12
13
Full resolution images are 16,000 x 16,000 (M-bands, DNB) and 32,000 x 32,000 pixels (I-bands), increasing the load on your browser compared to ABI For the Solar Reflective Bands (M1- M11, I1-I3) in the summer months, more than half the image will be
more than half the image will be black, and you lose information over the poles. (But you still have the DNB and IR bands.) The more VIS/NIR data there is in the Northern Hemisphere, the less there is in the Southern Hemisphere (and vice versa). It should also go without saying that, the closer you are to the pole, the more overpasses you get, improving apparent motions and the feature tracking (“Flow-Following”) utility. Some of the data in each image is up to 12 hours old!
Animated GIF
14
S-NPP data is only downlinked from
from both Svalbard and McMurdo. This means more recent NOAA-20 data may arrive before older S-NPP
SLIDER after S-NPP processing is complete. Full resolution images are 16,000 x 16,000 pixels (M-bands & DNB), 32,000 x 32,000 (I-bands), which puts more strain on your web browser than GOES-R ABI. Each individual orbit image contains ~51
to match the last VIIRS granule to cross the Equator in each hemisphere. At this time, we lack the ability to go back and reprocess missing granules. With current computing power, it takes ~50 minutes to process the ~100 min. of data from each orbit (M- bands).
Svalbard McMurdo
Background Image Credit: NASA/Goddard
15
Parallax effects may be significant for
to apparent motion that is not actually occurring. Hurricane Lane did not move back to the east during this time period.
16
NUCAPS is a suite of retrieval algorithms applied to polar-orbiting microwave and IR sounding data. One popular NUCAPS product now on Polar SLIDER is Cold Air Aloft. Cold Air Aloft is defined by air temperatures
aircraft fuel begins to freeze, which is a significant hazard for aviation. When cold air aloft is present, zoom in on SLIDER to view flight levels impacted by the cold air. Currently Northern Hemisphere only Contact me if you would like a Southern Hemisphere version on SLIDER
17
I. It causes my web browser or computer to crash.
18