
SLIDE 1
Churches and chapels: the long view (England)
A 200-year perspective to help make sense of today’s changes and pressures
data for England only, except number 3 – rest of UK a different story
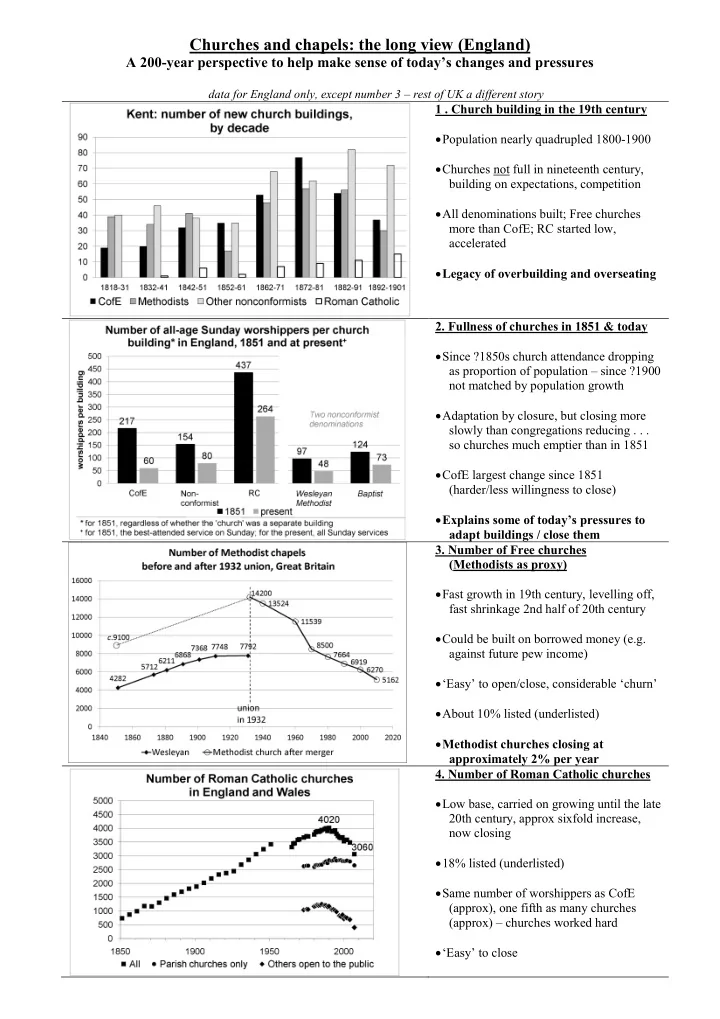
1 . Church building in the 19th century Population nearly quadrupled 1800-1900 Churches not full in nineteenth century, building on expectations, competition All denominations built; Free churches more than CofE; RC started low, accelerated Legacy of overbuilding and overseating
- 2. Fullness of churches in 1851 & today
Since ?1850s church attendance dropping as proportion of population – since ?1900 not matched by population growth Adaptation by closure, but closing more slowly than congregations reducing . . . so churches much emptier than in 1851 CofE largest change since 1851 (harder/less willingness to close) Explains some of today’s pressures to adapt buildings / close them
- 3. Number of Free churches
(Methodists as proxy) Fast growth in 19th century, levelling off, fast shrinkage 2nd half of 20th century Could be built on borrowed money (e.g. against future pew income) ‘Easy’ to open/close, considerable ‘churn’ About 10% listed (underlisted) Methodist churches closing at approximately 2% per year
- 4. Number of Roman Catholic churches