
SLIDE 1
Prepared by Resource Development Associates
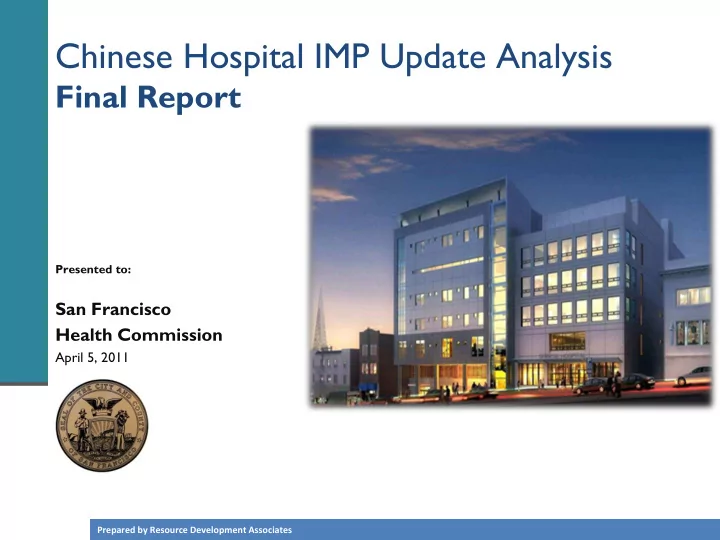
Chinese Hospital IMP Update Analysis
Final Report
Presented to:
San Francisco Health Commission
April 5, 2011
Chinese Hospital IMP Update Analysis Final Report Presented to: - - PowerPoint PPT Presentation
Chinese Hospital IMP Update Analysis Final Report Presented to: San Francisco Health Commission April 5, 2011 Prepared by Resource Development Associates 2 Outline 1 Projected Community Health Impact 2 Additional Community Health
Prepared by Resource Development Associates
Presented to:
San Francisco Health Commission
April 5, 2011
Prepared by Resource Development Associates
2
Projected Community Health Impact
Recommendations to the Commission
Prepared by Resource Development Associates
3
Additional Community Health Assessment Findings
Recommendations to the Commission
Prepared by Resource Development Associates
4
1 2 3 4
Prepared by Resource Development Associates
5
rebuild
access to services
Little Knowledge No Knowledge Very Familiar Little Knowledge No Knowledge
Among CHASF Patients…
Not Concerned About Rebuild Concerned About Rebuild Easier 67% Harder 0% Don't Know 33%
Will the rebuild make it easier
Chinese Hospital?
Prepared by Resource Development Associates
6
have ample excess capacity
CHASF and SF General
indicated desire for services at a Western clinic (in the absence of CHASF)
Prepared by Resource Development Associates
7
Chinese patients
Younger Chinese – including recent immigrants – seek linguistically-competent services
be more attractive to wider community
0.2% 1.6% 9.5% 45.6% 43.0%
0 - 19 20 -39 40 - 59 60 - 79 80+ Proportion of 2008 CHASF Discharges by Age
Prepared by Resource Development Associates
8
9% 0% 5% 55% 18% 14% Maternity Mental health services Pediatrics Skilled nursing Emergency
care Other
Which services were you seeking?
Yes, this has happened a lot Yes, this has happened
twice No, this has not happened
Have you been referred to another hospital for services?
Prepared by Resource Development Associates
9
50% 11% 12% 22% 98% 1% 0% 0% 90% 7% 2% 1%
API White Hispanic Black
Proportion of SF Hospital Patients, CHASF Patients and Staff by Race, 2009
All Citywide Hospital Patients CHASF Hospital Patients CHASF Staff
First language?
Other Chinese English Mandarin Cantonese
Prepared by Resource Development Associates
10 Domain 1: Access to Services
Stakeholder Quote We can’t start with the given that everyone is
providers are accepting? Its hard for providers to understand this… That is why it is so important to have visible safe spaces with signage.”
Stakeholder Quote “Its as simple as having a staff person who makes sure to welcome and smile to trans[gender] individuals when they come for help”
Prepared by Resource Development Associates
11 Domain 2: Appropriateness of Services
demographics of patient base
CHASF services to patient base
43 52 41 49 36 40 35 40 45 50 55 2000 2010 2020 2030 2040 2050
Average Resident Age Projections
Asian SF residents All SF residents All Ca residents
25% 23% 20% 13% 4% 15%
Nervous System Digestive System Cancer Circulatory System Genitourinary System All Other Diagnoses*
Proportion of Ambulatory Surgery Services - Principal Diagnosis
Prepared by Resource Development Associates
12 Domain 2: Appropriateness of Services
1619 2,321 1500 1750 2000 2250 2002 2010 2018 2026 2034 2042 2050 SNF Beds Year
SNF Demand Model
Projected Actual and Needed SNF Beds Citywide, 2002 - 2050 Sources: RDA analysis using data from OSHPD, CA Dept of Finance
Demand Model Notes: assumes 365 licensed bed days per bed per year, 0.79 patient days per city resident per year, and continuous 80% bed utilization
Projected actual SNF Beds after CHASF rebuild Projected actual SNF Beds Actual SNF Beds Citywide Number of beds needed to maintain 20% citywide SNF bed availability
Prepared by Resource Development Associates
13 Domain 3: Quality of Services
current medical standards
standard of care
Stakeholder Quote “Our current building was changed at the 11th hour from office building to hospital – it has always been a poor design for infection control, privacy, discussions with clergy, and family.”
Will planned changes increase or decrease the quality of care?
Decrease Not sure
seating in waiting areas; crowded rooms
Increase
Prepared by Resource Development Associates
14 Domain 3: Quality of Services
ambulatory surgery unit
effective
Stakeholder Quote “Because of medical and technological advances, services [in general] are going to shift more to outpatient care. Already we are seeing eye surgery and others … that are not hospital based. This seems to be a growing trend. ”
Digestive Surgery Eye Surgery Integument ary Surgery Pathology / Lab Radiology Other Surgery
Outpatient Surgery Services Provided, 2009
Prepared by Resource Development Associates
15 Domain 4: Efficiency of Service Delivery
citywide despite highest cost-to- charge ratio
by managed care premiums
CHASF 2009 Income Statement
Gross Patient Revenue 176,961,364
(137,421,271) + Capitation Premium Rev. 50,864,577 Net Patient Revenue 90,404,670 + Other Operating Revenue 1,386,824 T
91,791,494
(83,148,390) Net from Operations 8,643,104 + Non-Operating Revenue 780,240
(154,194)
2009 Net Income $ 9,269,150
46% 41% 27% 27% 26% 24% 24% Chinese SF General UCSF CPMC St. Lukes St. Francis St. Mary's
(24%) (13%) (7%) (3%) 5% 10% 17%
SF General St. Francis St. Mary's UCSF Chinese CPMC
Net Income Margins
Prepared by Resource Development Associates
16 Domain 4: Efficiency of Service Delivery
efficiently than other hospitals
capital reserves; $50 million in capital campaign
0.2 1.1 1.5 1.8 2.2 2.2 2.9
Chinese
SF General
UCSF CPMC
Current Ratios (assets / liabilities)
14.3 34.2 46.0 56.6 59.8 65.7 70.8 Chinese SF General
UCSF CPMC
Days in Accounts Receiveable Stakeholder Quote “The fundraising, from what I can tell, is on pace. I am not hugely concerned. It is a project that has to get done.”
Prepared by Resource Development Associates
17
Projected Community Health Impact
Recommendations to the Commission
Prepared by Resource Development Associates
18
35% 20% 18% 24% 4% 50% 22% 12% 11% 4% 45% 32% 13% 7% 3%
Caucasian Asian & Pacific Islander Latino African AmericanOther
Proportion of Services Received and Total Population, San Francisco, 2009
Mental Health Primary Health City Population Yes No
Should Chinese Hospital
services?
mental health services per capita than any other race group
CHASF patients believe CHASF should offer more mental health services
Prepared by Resource Development Associates
19
7.0 13.3 5.4 3.1 3.3
Chinese CPMC
FY 2009 Charity Patients per Hospital Bed
relative to its clinical capacity
insurance products to individuals and businesses across the city
CHASF due to relative uniqueness of revenue stream (high charge-to-cost)
Prepared by Resource Development Associates
20
emergency services
City hospitals
less severe than for most other SF hospitals
25,000 50,000
CPMC - West Kaiser CPMC - Pacific CPMC - Davies SF General
UCSF Chinese
2009 Emergency Department Visits Citywide
0% 10% 20% 30% 40% 50% 60% 70% 80% 90% 100%
CPMC - West Kaiser CPMC - Pacific CPMC - Davies SF General
UCSF Chinese
Severity of 2009 ED Services
Minor Low / Moderate Moderate Severe w/o threat Severe w/ threat
Prepared by Resource Development Associates
21
Additional Community Health Assessment Findings
Projected Community Health Impact
Prepared by Resource Development Associates
22
processes to closely monitor bed levels
community health settings
demographic patterns and community health needs in Chinatown
neighboring communities
Prepared by Resource Development Associates
Prepared by Resource Development Associates
Prepared by Resource Development Associates
25
Demolish current parking structure and administration building Build and open new hospital facility
Prepared by Resource Development Associates
26