chedeski fire nutrient loading into roosevelt
play

Chedeski Fire . Nutrient Loading into Roosevelt Y Summer 04 - PowerPoint PPT Presentation

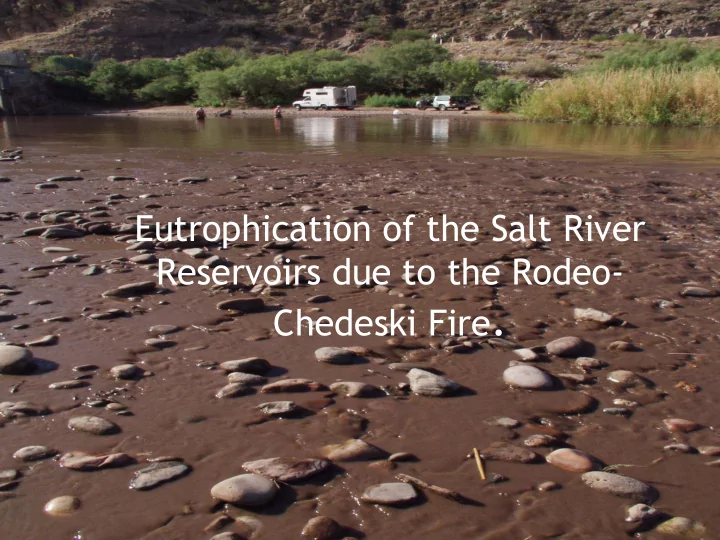
Eutrophication of the Salt River Reservoirs due to the Rodeo- Chedeski Fire . Nutrient Loading into Roosevelt Y Summer 04 Spring 04 Mean(Ammonia_N_mgPerL_asN) Mean(NitrateNitrite_N_ppm) Winter 04 Sampling_Period Mean(Total_P_ppm) Fall 03


  1. Eutrophication of the Salt River Reservoirs due to the Rodeo- Chedeski Fire .

  2. Nutrient Loading into Roosevelt Y Summer 04 Spring 04 Mean(Ammonia_N_mgPerL_asN) Mean(NitrateNitrite_N_ppm) Winter 04 Sampling_Period Mean(Total_P_ppm) Fall 03 Mean(Total_Kjeldahl_Nitrogen_mgPerl_as_N Summer 03 Spring 03 Winter 02/03 Fall 02 Summer 02 0 5 10 15 20 25 30 35 Y

  3. TOC/DOC in the Salt River above Roosevelt Chart OverlayChart Y Summer 04 Spring 04 Mean(TOC_ppm) Winter 04 Mean(DOC_ppm) Sampling_Period Fall 03 Summer 03 Spring 03 Winter 02/03 Fall 02 Summer 02 0 5 10 15 20 25 30 35 Y

  4. Summer Nutrient Levels from Roosevelt (mean for all sites) Y Mean(Ammonia_N_mgPerL_asN) Summer 04 Mean(NitrateNitrite_N_ppm) Sampling_Period Mean(Total_P_ppm) Mean(Total_Kjeldahl_Nitrogen_mgPe Summer 03 Summer 02 .0 .1 .2 .3 .4 .5 .6 .7 .8 .9 1.0 1.1 Y

  5. Oneway Analysis of DO_mg_per_L By Sampling_Period 0.6 0.5 0.4 DO_mg_per_L 0.3 0.2 0.1 0 All Pairs Summer 02 Summer 03 Summer 04 Tukey-Kramer 0.05 Sampling_Period Oneway Anova Summary of Fit Rsquare 0.767716 Adj Rsquare 0.758782 Root Mean Square Error 0.056288 Mean of Response 0.189455 Observations (or Sum Wgts) 55 Analysis of Variance Source DF Sum of Squares Mean Square F Ratio Prob > F Sampling_Period 2 0.54452819 0.272264 85.9318 <.0001 Error 52 0.16475544 0.003168 C. Total 54 0.70928364 Means for Oneway Anova Level Number Mean Std Error Lower 95% Upper 95% Summer 02 13 0.356923 0.01561 0.32560 0.38825 Summer 03 27 0.167407 0.01083 0.14567 0.18914 Summer 04 15 0.084000 0.01453 0.05484 0.11316 Std Error uses a pooled estimate of error variance

  6. PCA of Primary Production in Roosevelt Spinning Plot Components: Chl_a_mgPerm3 Total_P DOC_ppm TOC_ppm Ammonia_N_mgPerL_asN Ammonia NitrateNitrite_N_ppm y Total_P_ppm Nitrate Total_Kjeldahl_Nitrogen_mgPerl_ Prin Comp 1 Prin Comp 2 Chl_a_m Prin Comp 3 Prin Comp 4 Total_K Prin Comp 5 Prin Comp 6 z x Prin Comp 7 TOC_ppm DOC_ppm

  7. Mean Hypolimnetic DO Levels by Reservoir 5 4 DO_mg_per_L 3 2 1 0 Apache Canyon Roosevelt Saguaro Reservoir Oneway Anova Summary of Fit Rsquare 0.022082 Adj Rsquare 0.009755 Root Mean Square Error 1.07882 Mean of Response 0.719421 Observations (or Sum Wgts) 242 Analysis of Variance Source DF Sum of Squares Mean Square F Ratio Prob > F Reservoir 3 6.25467 2.08489 1.7914 0.1495 Error 238 276.99705 1.16385 C. Total 241 283.25172 Means for Oneway Anova Level Number Mean Std Error Lower 95% Upper 95% Apache 105 0.73124 0.10528 0.52383 0.9386 Canyon 13 1.10077 0.29921 0.51133 1.6902 Roosevelt 58 0.47690 0.14166 0.19784 0.7560 Saguaro 66 0.83864 0.13279 0.57704 1.1002

  8. Mean Summer Hypolimnetic DO Levels for all Salt River Reservoirs by Year Chart Summer 04 Sampling_Period Summer 03 Summer 02 .0 .1 .2 .3 .4 .5 .6 .7 .8 .9 1.0 Mean(DO_mg_per_L) Sampling_Period Summer 02 Summer 03 Summer 04

  9. PCA of Primary Production in Apache, Canyon, and Saguaro Spinning Plot Components: Chl_a_mgPerm3 DOC_ppm TOC_ppm Ammonia_N_mgPerL_asN Chl_a_m y NitrateNitrite_N_ppm Total_P_ppm Total_Kjeldahl_Nitrogen_mgPerl_ Prin Comp 1 Nitrate Prin Comp 2 Total_K Prin Comp 3 Total_P Prin Comp 4 Prin Comp 5 z x Prin Comp 6 DOC_ppm Prin Comp 7 TOC_ppm Ammonia

  10. Mean Chlorophyll a values for Apache, Canyon, and Saguaro Reservoirs by Season and Year Summer 04 Spring 04 Winter 04 Sampling_Period Fall 03 Summer 03 Spring 03 Winter 02/03 Fall 02 Summer 02 0 10 Mean(Chl_a_mgPerm3)

  11. • Autochthonous processes within the reservoirs may mean eutrophication proceeds unabated long after nutrient loading via the Salt River has diminished. • This will have consequences, some severe and others subtle, on water quality entering the Valley for some years to come.

  12. Algal Toxins in the Salt River Reservoirs

  13. • We routinely sample for anatoxin- a, microcystin, and cylindrospermopsin. • We first discovered C. raciborskii in Arizona in 2001. • Numbers have increased in all reservoirs surrounding the Valley since that time

  14. Analytical Methods • Anatoxin-a, Saxitoxin – HPLC after fluorescent derivatization. • Microcystin – Protein phosphatase inhibition assay. • If greater than 0.5 µg/L, confirmed by HPLC using a PDA detector. • Cylindrospermopsin – HPLC using a photodiode array detector • Detection limit for all assays is less than 0.1 µg/L

  15. Fish Kills • First major fish kill occurred in Apache in March of 2004. • Subsequent fish kills occurred in Canyon, Saguaro, and again in Apache throughout the spring and early summer. • Multiple species involved. • All water quality variables were “normal”

  16. • A major fish kill occurred in the riverine portion of Saguaro on 6/10/04. • Smaller fish (e.g., threadfin shad) were noticed dead or moribund in Canyon on 6/9/04.

  17. • Relatively large background levels of microcystin in all watersheds. • Etiology of the fish kills implicate a fast-acting neurotoxin such as anatoxin-a. • While levels of C. raciborskii steadily rose throughout the summer of 2004, only very low levels of cylindrospermopsin have been found.

  18. Persistence/Degradation of Toxins • Both cylindrospermopsin and microsystin are environmentally stable compounds. • Anatoxin-a, however, is rapidly degraded by sunlight and alkaline conditions with a half life of perhaps only a few hours.

  19. Anatoxin-a • Potent neurotoxin which causes rapid death by respiratory arrest. • Postsynaptic, depolarising, neuromuscular, blocking agent that binds strongly to the nicotinic acetylcholine receptor. • Produced by species of Anabaena, Aphanizomenon, Oscillatoria, and Microcystis.

  20. • No anatoxin-a found in aqueous samples. • However, anatoxin-a found at toxic levels in stomachs of fish. • Non-detectable amounts of fast- degrading toxins in aqueous samples can be dangerously misleading.

  21. Potentially Toxic Cyanobacteria Found in Salt River Reservoirs • Aphanizomenon flos-aquae • Anabaenopsis circularis • Anabaena laxa • Anabaena schremetievi • Anabaena torulosa • Anabaena variabilis • Cylindrospermopsis raciborskii • Merismopedia elegans • Microcystis • Pseudanabaena • Oscillatoria aghardii • Oscillatoria limnetica • and several more

  22. • It is impossible to determine toxicity based upon presence of an algal species alone. • The only way to quantify algal toxins is through direct measurement of either aqueous or biological samples. • Most of the cyanobacteria found within the reservoirs are ubiquitous and probably do not produce toxins the majority of the time.

  23. • Based upon our large database of algae identifications, there is NO correlation between numbers of potentially toxic species and toxic events.

  24. Why Were the Toxic Events Worse in the Upper Reaches of Saguaro? • Unknown but pump-back storage at Canyon may play a role. • This area has had other toxic events and in 2001 we found over 140 µ g/L of anatoxin-a. • This was the highest level of anatoxin-a ever recorded by the reporting lab.

  25. Toxicity based upon Environmental Conditions • No correlation to toxicity and number of species suggests that a few of the suspect species produce copious amounts of toxin at a specific time based upon environmental conditions.

  26. Allelopathy

  27. Defense from Grazing by Zooplankton

  28. Why were no Humans Affected? • Fish and mollusks are especially susceptible due to rapid uptake across gills. • Just because toxicity occurs in fish does not mean toxicity will occur in humans. • However, fish and zooplankton serve as important biological indicators of toxicity.

  29. Algal Toxin Summary • Fish kills probably caused by anatoxin-a. • Possibly exacerbated by lysing of cells due to pump-back storage. • Several potentially toxic species found in ALL reservoirs surrounding the Valley and no correlation between biomass and toxicity.

  30. • Toxicity probably due to environmental factors such as removal of nutrient limitation, allelopathy, defense from grazing, etc. • C. raciborksii probably played no role in toxic events. • Dr. Paul Zimba (USDA) growing 2 isolates of C. raciborskii to check for toxicity.

  31. • Unialgal cultures of all potentially toxic species need to be established and then systematically checked for toxin production under different environmental conditions. • Without this data, predicting future toxic events by looking for any individual species is meaningless.

  32. Special Thanks • Susan Fitch, Linda Taunt, Jenny Hickman, Sam Rector, and Amanda Fawley from ADEQ. • Marc Dahlberg, Kevin Bright, and Larry Riley from AzG&F. • Dr. Greg Boyer from SUNY

  33. Questions?

Download Presentation
Download Policy: The content available on the website is offered to you 'AS IS' for your personal information and use only. It cannot be commercialized, licensed, or distributed on other websites without prior consent from the author. To download a presentation, simply click this link. If you encounter any difficulties during the download process, it's possible that the publisher has removed the file from their server.

Recommend


More recommend