
SLIDE 1
+
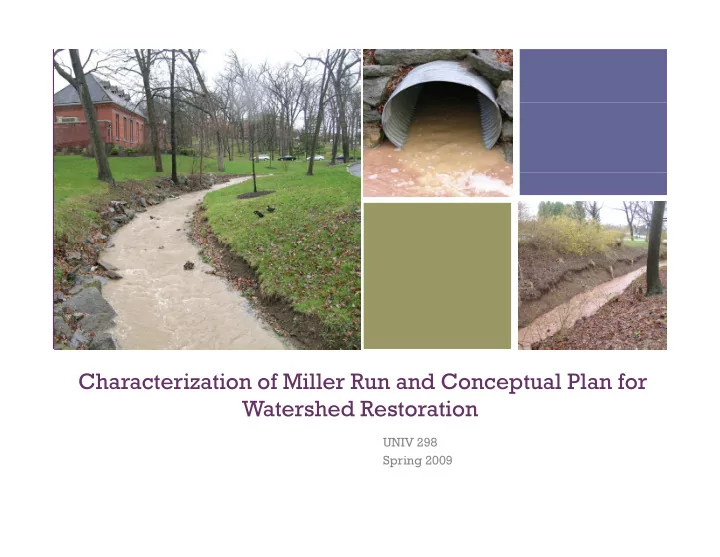
Characterization of Miller Run and Conceptual Plan for Characterization of Miller Run and Conceptual Plan for Watershed Restoration
UNIV 298 Spring 2009
+ Characterization of Miller Run and Conceptual Plan for - - PowerPoint PPT Presentation
+ Characterization of Miller Run and Conceptual Plan for Characterization of Miller Run and Conceptual Plan for Watershed Restoration UNIV 298 Spring 2009 + Miller Run: An Overview + Miller Run Statistics 80% of Miller Run is owned by
Characterization of Miller Run and Conceptual Plan for Characterization of Miller Run and Conceptual Plan for Watershed Restoration
UNIV 298 Spring 2009
+ Miller Run: An Overview
+ Miller Run Statistics
80% of Miller Run is owned by Bucknell. The runoff from the new housing developments also contribute to the stream. Length of Stream: 2,000m Percent Forest: 13.1% (The Grove and the Golf Course) Percent Urban: 37.5% (Buildings and Roads) Channelized: 75-100% 50% Rip-rap
Source: streamstats.usgs.gov (2009)
+ Introduction to the Presentation
Characterization of Miller Run
The impairment of the stream: The Channel The Water
Conceptual Plan
Our Proposed Solutions The Costs of Our Proposed Solutions
Conclusions
What Miller Run Could Be
Photo Courtesy of: http://www.facstaff.bucknell.edu + Project Goals
Flood Control
Storm Water Management
Retention
Infiltration
Aesthetic Appeal
Native Species
Riparian Health
Recreation
Improve Ecological Health
Year-Round Flow
Sewage Recycling
Habitat- Diversity
Water Quality
Target Species
Channel Sustainability
Space for Migration
Structure Renewal
Environmental Education
Watershed Management
Learning and Teaching
Miller Run Today What Miller Run Could Be
Photo Taken by Dina El-Mogazi at Wellesley College + The Characterization of Miller Run
Miller Run Put Into Perspective
+
+
B I M O S Z A A GG LL NN QQ VV ZZ EEE
MR 2 MR 1
+
5 10 15 20 Vertical (m) Horizontal from left bank (m)
Cross Section B
5 10 15 20 Vertical (m) Horizontal from left bank (m)
Cross Section I
5 10 15 20 Vertical (m) Horizontal from left bank (m)
Cross Section M
Reach 1
+
5 10 15 20 Vertical (m) Horizontal from left bank (m)
Cross Section O
5 10 15 20 Vertical (m) Horizontal from left bank (m)
Cross Section S
5 10 15 20 Vertical (m) Horizontal from left bank (m)
Cross Section Z
Reach 2
+
5 10 15 20 Vertical (m) Horizontal from left bank (m)
Cross Section AA
5 10 15 20 Vertical (m) Horizontal from left bank (m)
Cross Section GG
5 10 15 20 Vertical (m) Horizontal from left bank (m)
Cross Section LL
Reach 3
+
5 10 15 20 Vertical (m) Horizontal from left bank (m)
Cross Section NN
5 10 15 20 Vertical (m) Horizontal from left bank (m)
Cross Section QQ
5 10 15 20 Vertical (m) Horizontal from left bank (m)
Cross Section VV
Reach 4
+
5 10 15 20 Vertical (m) Horizontal from left bank (m)
Cross Section XX
5 10 15 20 Vertical (m) Horizontal from left bank (m)
Cross Section ZZ
5 10 15 20 Vertical (m) Horizontal from left bank (m)
Cross Section EEE
Reach 5
+
+
+Hydrologic Issues
Portions of Miller Run frequently go dry Water quickly enters and exits the system High sediment content: hinders life, destroys restoration
structures
0.000 0.020 0.040 0.060 0.080 0.100 0.120 0.140 6/4/2008 0:03 6/14/2008 0:03 6/24/2008 0:03 7/4/2008 0:03 7/14/2008 0:03 7/24/2008 0:03 Discharge (m3/s) Time
Frequent Periods of Zero Flow
+Methodology
Established gauges upstream and downstream to measure
the height of the water
Used rating curve and Manning Equation to calculate
discharge (flow of water over time)
Upstream: y = 1.3806x0.2115 R2 = 0.9822 Dow nstream: y = 1.5511x0.211 R2 = 0.933 0.2 0.4 0.6 0.8 1 1.2 1.4 1.6 1.8 0.1 0.2 0.3 0.4 0.5 0.6 0.7 0.8 0.9 1 Discharge (m 3/s) Stage (ft) Dow nstrream Upstream UPSTREA M MR1 GAUGE DOWNSTRE AM MR2 GAUGE CAMPUS
+Flow
0.2 0.4 0.6 0.8 1 1.2 2/7/09 17:00 2/7/09 23:00 2/8/09 5:00 2/8/09 11:00 2/8/09 17:00 2/8/09 23:00 2/9/09 5:00 2/9/09 11:00 2/9/09 17:00 2/9/09 23:00 2/10/09 5:00 2/10/09 11:00 2/10/09 17:00 2/10/09 23:00
Discharge (m3/s)
Time
February Snow Melt Hydrograph
Upstream Downstream
0.005 0.01 0.015 0.02 0.025 0.03 2/18/09 0:00 2/18/09 6:00 2/18/09 12:00 2/18/09 18:00 2/19/09 0:00 2/19/09 6:00 2/19/09 12:00 2/19/09 18:00 2/20/09 0:00 2/20/09 6:00 2/20/09 12:00 2/20/09 18:00 2/21/09 0:00
Discharge (m3/s)
Time
Feb 18 Snowmelt and Rain Event Hydrograph
Upstream
+
Storm Pipes throughout campus responsible for the double peak
0.005 0.01 0.015 0.02 0.025 0.03 0.035 0.04 0.045 0.01 0.02 0.03 0.04 0.05 0.06 0.07 3/26/2009 14:00 3/26/2009 16:00 3/26/2009 18:00 3/26/2009 20:00 3/26/2009 22:00 3/27/2009 0:00 3/27/2009 2:00
Rainfall (in.)
Discharge (m3/s)
Time
Upstream Discharge Lag Time For Small Rainfall Event
Discharge Rain
0.005 0.01 0.015 0.02 0.025 0.03 0.035 0.04 0.045 0.01 0.02 0.03 0.04 0.05 0.06 0.07 3/26/09 14:00 3/26/09 16:00 3/26/09 18:00 3/26/09 20:00 3/26/09 22:00 3/27/09 0:00 3/27/09 2:00
Rainfall (in.) Discharge (m3/s) Time
Downstream Discharge Lag Time For Small Rainfall Event
Discharge Rain
0.05 0.1 0.15 0.2 0.25 0.05 0.1 0.15 0.2 0.25 1/7/2009 9:00 1/7/2009 11:00 1/7/2009 13:00 1/7/2009 15:00 1/7/2009 17:00 1/7/2009 19:00 1/7/2009 21:00 1/7/2009 23:00 1/8/2009 1:00 1/8/2009 3:00
Rainfall (in.)
Discharge (m3/s)
Time
Upstream Discharge Lag Time For Large Rainfall Event
Discharge Rain
0.05 0.1 0.15 0.2 0.25 0.05 0.1 0.15 0.2 0.25 1/7/09 9:00 1/7/09 11:00 1/7/09 13:00 1/7/09 15:00 1/7/09 17:00 1/7/09 19:00 1/7/09 21:00 1/7/09 23:00 1/8/09 1:00 1/8/09 3:00
Rainfall (in.)
Discharge (m3/s)
Time
Downstream Discharge Lag Time For Large Rainfall Event
Discharge Rain
50 100 150 200 250 300 350 400 450 0.2 0.4 0.6 0.8 1 1.2 2/6/2009 16:34 2/7/2009 4:34 2/7/2009 16:34 2/8/2009 4:34 2/8/2009 16:34 2/9/2009 4:34 2/9/2009 16:34 2/10/2009 4:34
Sediment Concetration (PPM)
Discharge (m3/s)
Time
Upstream Discharge and Sediment Concentration
Discharge Sediment
50 100 150 200 250 300 350 400 450 0.2 0.4 0.6 0.8 1 1.2 2/6/09 16:00 2/7/09 4:00 2/7/09 16:00 2/8/09 4:00 2/8/09 16:00 2/9/09 4:00 2/9/09 16:00 2/10/09 4:00
Sediment Concentration (PPM)
Discharge (m3/s)
Time
Downstream Discharge and Sediment Concentration
Discharge Sediment
+
224 18 117 253 205 606 2287 270 371 625 1798 521 Concentrations In Parts Per Million
+ Water Quality
Final Report
+Water Chemistry
Tests Used: Sondes were used to automatically record stream
conditions such as temperature, pH, specific conductivity, and dissolved oxygen.
Water samples were also taken manually during normal
flow and high flow events, and analyzed for chemical composition.
Two sites were sampled for each reading; MR-1 was
upstream at the Art Barn crossing and MR-2 was downstream at Bucknell Hall.
+ Baseline Ion Concentrations
Dissolved Solid Concentration (mg/L) Ammonium <10 Sulfate 34 Chloride 81.7 Nitrate 1.9 Phosphorous <0.1 Sodium 32.2 Potassium 3.2 Magnesium 9.7 Calcium 57.9 Manganese 0.05 Iron 0.2 Lead <0.01 Zinc <0.02 Chromium <0.004 Copper <0.04 Nickel <0.005 Cadmium <0.001 Arsenic <0.005 Downstream Site- February 17, 2009 Upstream Site February 17, 2009 Dissolved Solid Concentration (mg/L) Ammonium <10 Sulfate 48 Chloride 47.9 Nitrate 1.98 Phosphorous <0.1 Sodium 21.9 Potassium 2.8 Magnesium 9.9 Calcium 53.5 Manganese <0.03 Iron 0.23 Lead <0.01 Zinc <0.02 Chromium <0.004 Copper <0.04 Nickel <0.005 Cadmium <0.001 Arsenic <0.005
+
Sodium, Chloride, and Potassium Fluctuations (February 7-9, 2009 Snowmelt)
10 20 30 40 50 60 70 80 90 100 5 10 15 20 25 30 35 40 45 50 [Na+] (mg/L) Time (hr)
[Na+]
Upstream (Art Barn) Downstream (Hunt Hall) 50 100 150 200 250 300 5 10 15 20 25 30 35 40 45 50 [Cl-] (mg/L) Time (hr)
[Cl-]
Upstream (Art Barn) Downstream (Hunt Hall) 2 4 6 8 10 12 5 10 15 20 25 30 35 40 45 50 [K+] (mg/L) Time (hr)
[K+]
Upstream (Art Barn) Downstream (Hunt Hall)
Negative Impacts: Surface runoff and interflow carry high ion loads into the waterway from road salts and fertilizers.
+
10 20 30 40 50 60 70 5 10 15 20 25 30 35 40 45 50 [SO4
2-] (mg/L)Time (hr)
[SO4
2-]
Upstream (Art Barn) Downstream (Hunt Hall)
Sulfate and Nitrate Fluctuations (February 7-9, 2009 Snowmelt)
0.0 0.5 1.0 1.5 2.0 2.5 5 10 15 20 25 30 35 40 45 50 [NO3
Time (hr)
[NO3
Upstream (Art Barn) Downstream (Hunt Hall)
Negative Impacts:
to simple dilution.
underground contaminant located near the upstream site- probably fertilizer accumulation or a broken sewage line.
+ Ammonium and Phosphorous Fluctuations
(February 7-9, 2009 Snowmelt)
0.0 0.2 0.4 0.6 0.8 1.0 1.2 1.4 5 10 15 20 25 30 35 40 45 50 [NH4
+] (mg/L)Time (hr)
[NH4
+]
Upstream (Art Barn) Downstream (Hunt Hall) 0.00 0.02 0.04 0.06 0.08 0.10 0.12 0.14 0.16 0.18 5 10 15 20 25 30 35 40 45 50 [SRP] (mg/L) Time (hr)
[Soluble Reactive Phosphorous]
Upstream (Art Barn) Downstream (Hunt Hall)
Delayed peak reveals an underground source
upstream site.
+Dissolved Oxygen- Baseline and April 3, 2009 Rain event Comparisons
5 6 7 8 9 10 11 12 4 8 12 16 20 24 [DO] (mg/L) Time (hr)
Baseline (April 4)
Upstream (Art Barn) Downstream (Hunt Hall) 5 6 7 8 9 10 11 12 4 8 12 16 20 24 [DO] (mg/L) Time (hr)
April 3 Rain Event
Upstream (Art Barn) Downstream (Hunt Hall)
+
MR-1: Art Barn MR-2: Gerhard Field House- Rt. 15 MR-3: KLARC Building MR-4: Loomis St./Art Building
+ Habitat Assessment
Site MR-1 (Art Barn) MR-2 (Gerhard Fieldhouse - U.S. 15) MR-3 (Kenneth G. Langone Athletics and Recreation Center) MR-4 (Loomis Street – Art Building) Instream Cover(fish)
6 (Marginal) 8 (Marginal) 10 (Marginal) 7 (Marginal)
Epifaunal Substrate
8 (Marginal) 12 (Suboptimal) 7 (Marginal) 8 (Marginal)
Embeddedness
18 (Optimal) 3 (Poor) 3 (Poor) 3 (Poor)
Velocity/Depth Regimes
7 (Marginal) 7 (Marginal) 9 (Marginal) 8 (Marginal)
Channel Alteration
14 (Suboptimal) 3 (Poor) 1 (Poor) 3 (Poor)
Sediment Deposition
13 (Suboptimal) 7 (Marginal) 10 (Marginal) 8 (Marginal)
Frequency of Riffles
8 (Marginal) 12 (Suboptimal) 10 (Marginal) 3 (Poor)
Channel Flow Status
16 (Optimal) 14 (Suboptimal) 14 (Suboptimal) 7 (Marginal)
Condition of Banks
10 (Marginal) 14 (Suboptimal) 11 (Suboptimal) 7 (Marginal)
Bank Vegetative Protection
9 (Marginal) 5 (Poor) 1 (Poor) 1 (Poor)
Grazing or Other Disruptive Pressure
10 (Marginal) 6 (Marginal) 3( Poor) 3 (Poor)
Riparian Vegetative Zone Width
3 (Poor) 4 (Poor) 1 (Poor) 1 (Poor)
Total
122 95 80 59
Habitat Assessment
Marginal Marginal Marginal Poor
+ Biological Sampling
Reasons for Biotic Sampling:
Aquatic macroinvertebrates are highly variable in their sensitivity
to water pollution. These differences can be used by biologists to evaluate the overall health of a stream.
The link between fish species composition and water quality
provides an important assessment of stream ecosystem health.
Algae analyses allow us to determine gain information about the
biomass of algae, which is related to water chemistry and conditions of riparian vegetation.
+Macroinvertebrates
+Macroinvertebrate Results
measure the degree of a stream’s impairment.
significantly lower than the impairment threshold.
much lower biodiversity and fewer pollution-sensitive species.
20 40 60 80 100 1 2 3 4 IBI Score Sample Site: UpstreamDownstream
IBI Score of Miller Run Compared to Impairment Level
IBI Score Ref 5 10 15 20 25 30 1 2 3 4 Percent Intolerant Individuals Sampling Site: UpstreamDownstream
Pollution-Sensitive Macrointertebrates vs. Sampling Site
Percent Intolerant Individuals 0.5 1 1.5 2 2.5 3 1 2 3 4 Shannon Diversity Index Sample Site #
Shannon Diversity Index
Shannon Diversity
Algae Sampling
downstream, which may indicate increasing nutrient or light availability along Miller Run.
biomass in upstream reaches
by grazing by benthic macroinvertebrates or herbivorous fishes.
2 4 6 8 10 12 14 MR1 MR2 MR3 MR4 Chlorophyll a (μg/cm2) Sample Site
Relative Concentrations of Chlorophyl a
+
Electro-Fishing
Electro-Fishing
Twenty-three fish were collected at the two sample sites , with six species represented There was a >88% decrease in fish numbers at the downstream sampling site, and a decrease in total species diversity by >83%. We expected that there would be more species near Bull Run, due to colonization. This indicates a substantial difference in the quality of habitat available at downstream versus upstream locations.
Family Genus Species Adult Juvenile Tot al Centrarchidae Lepomis macrochirus 1 3 4 gibbosus 1 1 Cyprinidae Campostoma anomalum 1 1 Semotilus atromaculatus 11 11 Exoglossum maxillingua 2 2 Luxilis cornutus 1 1 Total 17 3 20 Family Genus Species Adult Juvenile Total Cyprinidae Semotilus atromaculatus 3 3 Total 3 3
Downstream Site Upstream Site
+ Conceptual Plan For Miller Run
Proposed Solutions for the Lasting Health
+
Flood control – Stormwater management, Water retention, low flow
augmentation, out-of-channel solutions
Aesthetic appeal – Appropriate stream landscaping,
recreational (walking/biking) & meditation space, Bucknell as an example, community green space
Environmental education – Watershed
management, “outdoor classroom”, research opportunities
Ecological health and
sustainability – Maintain year-round flow, provide habitat for target
species, encourage native species growth
Channel sustainability – Space for
migration/channel evolution, structure/obstruction removal or replacement, bank stability measures, floodplain reconnection
Bucknell is what we call an impermeable jungle. The campus is covered with ugly asphalt walkways and parking lots and large buildings which do not have efficient storm water management structures. This needs to change to help replenish the ground water and reduce runoff.
+
directly into Miller Run.
produced.
before upstream.
block pavers
+
Permeable Pavements
no greater than 5-20 degrees, which is a great deal of campus.
be maintained.
the eye than others, but all are better than the ugly asphalt now.
+Stepped Infiltration Trenches
+
Possible Sites
+ Roof Runoff feeding into Infiltration
Trenches
+ Possible Sites
+Rain Garden
+Rain Garden
+Possible Sites
+
+
Two wetland areas
Sojka Lawn Mod Field area
Floodplain reconnection Stream corridor/vegetation
Biodegradable fabrics Plant natives
Villanova University
+ Reach 2A- 3
+
Rip-rap/obstructions Expand natural areas Restoring and fostering native
habitats
Recreation & meditation space Bucknell as an example
Villanova University
+
“outdoor classrooms”
Biology Engineering Geology Environmental Studies The Arts
Bike/walking path-
increase community interaction with stream/environment
University of Delaware
+
Widening of stream corridor allows for formation of diverse habitat-
both biota (fish, etc.)& abiota
Year-round stream flow (low flow augmentation)
www.creativehabitatcorp.com/stream.html
+
evolution and migration
reconnection
http://www.boquetriver.org/newswillsborocrib.ht l http://www.fws.gov/midwest/Fisheries/streamcrossings/ReplacementStruct ht
+ Reach 2b
+Economic Feasibility of Restoration
Out of Stream Structures
COST ANALYSIS Storm Water Management Construction: Rain Gardens $ 6 1000 $ 6,000 Infiltration Trenches 7 30,000 210,000 Permeable Pavement 6 175,111 1,050,866 Grand Total: $ 19 $ 1,266,666
In Stream Structures
COST ANALYSIS Channel Restoration Demolition: Unit Cost Units est. Total Cost Rip Rap $ 42 2,400 $ 100,440 Parking Surfaces: 2,250 923 Concrete Walls: 150 300 45,000 Culverts and Pipes: 290 20 5,791 Sub Totals: $ 482 $ 152,154 Construction: Log Cribbing $ 286 315 $ 90,090 Culvert 289.5 2 579 Wetlands: Sojka 150000 1 75,000 Wetlands: Mods 57100 1 57,100 Sub Totals: $207,676 $ 222,769 Grand Total: $208,157 $ 374,923
Total Project
COST ANALYSIS Channel Restoration Demolition: Unit Cost Units est. Total Cost Sub Totals: $ 482 $ 152,154 Construction: Sub Totals: $207,676 $ 222,769 Grand Total: $208,157 $ 374,923 Storm Water Management Construction: Grand Total: $ 19 $ 1,266,666
Permits 8,500 Legal Council 4,250.00 BU Facility Cost 17,000.00 Sub Totals: $ 1,671,339 Escalation & Contingency 50,140.17 Grand Total: $ 1,721,479
+Non-Scientific Benefits
The restoration of Miller Run dovetails with both campus and
community initiatives
Campus Master Plan Creation of green space and bike paths
Offers educational facilities to students and members of the
Lewisburg community
Sets Bucknell apart from peer schools Unique and exciting atmosphere to both live and work