
SLIDE 1
Chapter 9
Carbon Flux and Climate Change in Tropical Ecosystems
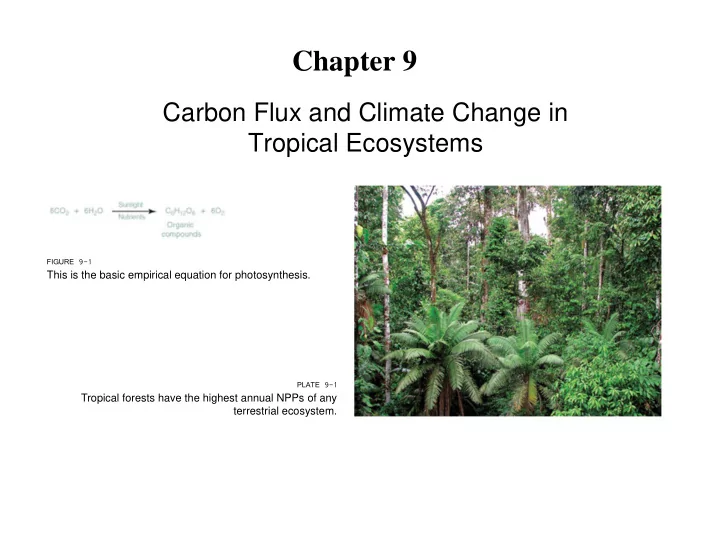
FIGURE 9-1 This is the basic empirical equation for photosynthesis. PLATE 9-1 Tropical forests have the highest annual NPPs of any terrestrial ecosystem.
Chapter 9 Carbon Flux and Climate Change in Tropical Ecosystems - - PowerPoint PPT Presentation
Chapter 9 Carbon Flux and Climate Change in Tropical Ecosystems FIGURE 9-1 This is the basic empirical equation for photosynthesis. PLATE 9-1 Tropical forests have the highest annual NPPs of any terrestrial ecosystem. PLATE 9-2 El Verde
FIGURE 9-1 This is the basic empirical equation for photosynthesis. PLATE 9-1 Tropical forests have the highest annual NPPs of any terrestrial ecosystem.
FIGURE 9-2 The pattern of carbon dioxide accumulation in Earth’s atmosphere. PLATE 9-2 El Verde rain forest in Puerto Rico.
FIGURE 9-3 Map of global net primary productivity. Note the concentration of NPP in equatorial regions, specifically forested areas.
FIGURE 9-4 This graph shows the NPP of ecosystems as reflected in their total area. What is of interest is that the open ocean, a vastly larger area than tropical rain forest, barely exceeds tropical rain forest in total global NPP. PLATE 9-3 This old pasture contains far less high biomass than the tropical forest it replaced. PLATE 9-4 In contrast with a pasture, interior tropical humid forest, with its massive tree boles, stores a great deal of carbon in the form of wood. Photo of the author next to a mature tree in the Peruvian Amazon.
PLATE 9-5 Early successional areas add biomass quickly with short-lived plant species that grow rapidly.
FIGURE 9-5 The terrestrial ecosystem model (TEM). The state variables are carbon in vegetation (CV); nitrogen in vegetation (NV);
(Nav). Arrows show carbon and nitrogen fluxes: GPP, gross primary productivity; RA, autotrophic respiration; RH, heterotrophic respiration; LC, litter-fall C; LN, litter-fall N; NUPTAKE, N uptake by vegetation; NETNMIN, net N mineralization of soil organic N; NINPUT, N inputs from outside the ecosystem; and NLOST, N losses from the ecosystem. FIGURE 9-6 (a) Potential natural vegetation types of South America as defined for the terrestrial ecosystem model. Each vegetation type is presumed to have unique properties with respect to carbon and nitrogen cycling processes and is presumed to interact with the environment in a unique fashion. (b) Potential annual net primary productivity (NPP, as carbon) in South America as determined by the terrestrial ecosystem model. All vegetation is assumed to be mature and undisturbed by human land-use activities. Units are grams of carbon per square meter per year.
FIGURE 9-7 Potential net primary productivity (NPP) in South America (as carbon) for the months of January, April, July, and
autotrophic respiration exceeded gross primary production during that month. The blockiness in these figures is due to the poor spatial resolution of the cloudiness data set used to estimate the monthly irradiance of photosynthetically active radiation.
FIGURE 9-8 Estimated monthly net primary productivity for six locations in South America. Monthly rainfall (—) is also shown for
corner of 0.5° latitude 0.5° longitude grid cells. PLATE 9-6 Cloud cover during rainy season may reduce NPP in lowland tropical forests.
PLATE 9-7 Deep shade affects patterns of carbon use by plants in rain forests.
FIGURE 9-9 Carbohydrate concentrations and pool sizes (mean SE) of dry (light brown bars) and moist (dark brown bars) tree species belonging to functional groups differing in shade tolerance (TST, total shade tolerants; PST, partial shade- tolerants; LLP, long-lived pioneers; SLP, short-lived pioneers). Bars within forest type accompanied by a different letter are significantly different (Student-Newman-Keuls test, P < 0.05). The total carbohydrate pool sizes are estimated for stems of 1-meter-tall saplings.
PLATE 9-8 Carbon sink? The immense amount of wood in tropical forests is why they seem to be ideal as potential carbon sinks.
FIGURE 9-10 Cumulative above-ground net biomass change (tons per hectare per year) in humid forests in (a) the tropics since 1958; (b) the Paleotropics (tropical Africa, Asia, Australia) since 1958; (c) the Neotropics (tropical Central and South America) since 1967; (d) the lowland Neotropics since 1971; and (e) Amazonia since 1975. Annual mean (solid line) and 95% confidence interval (dotted lines) values are based on the cumulative changes in individual sites since the first year and are scaled by a/b, where a the cumulative time elapsed since the first year and b the mean monitoring period per site up to each year end.
FIGURE 9-11 Histogram of annualized change in carbon stock from 79 long-term monitoring plots across 10 countries in Africa. Results are weighted by sampling effort. Note that most plots are accumulating carbon, but not all are.
FIGURE 9-12 Relative change in carbon stocks and corresponding wood mass density values: (a) all 612 fully identified species; (b) 200 fully identified genera.
PLATE 9-9 Is this tropical forest gaining or losing carbon? It is not possible to know with certainty without careful measurements. PLATE 9-10 Fires severely reduce the potential for forests to act as carbon sinks. FIGURE 9-13 Diagram of interrelationships between tropical land-cover changes and forest
directly affect forest fire occurrence; black arrows indirectly influence forest fire
strongly associated with deforestation. (b) Deforestation fragments the remaining forests, increasing amounts of edge. (c) Road building and paving directly affect transportation costs and area of economic accessibility. (d) Logging results in limited amounts of deforestation for roads and log landings. Post-logging colonization can increase deforestation. (e) Forest edges suffer biomass collapse and microclimate changes, making them susceptible to frequent fires. (f) Repeated forest fires can lead to unintentional deforestation. (g) Deforestation and pasture land maintenance fires result in many accidental forest fires. (h) Logging degrades forests, increasing fire susceptibility. (i) Forest fires can create a positive feedback cycle where recurrent fires become more likely and more severe with each occurrence.
FIGURE 9-14 Positive and negative feedbacks controlling fire processes in tropical forests. Positioning indicates whether they occur within or outside the forest (beige shading). Items in gold control fire occurrence or behavior. Items in brown modify the potential fire environment. Green indicates ecosystem processes acting in opposition to fire, specifically regrowth, canopy closure, and decay of fuels. The management efforts and interventions box indicates how and where human actions can diminish tropical forest fires. Climate change encompasses effects of increased CO2, land-cover change, and aerosol loading that result in regional drying in the tropics. RH, relative humidity.
FIGURE 9-15 Rivers and the carbon cycle. (a) Photosynthesis in land plants fixes atmospheric CO2 (inorganic carbon) as organic carbon, which is either stored as plant biomass or in soil, or is decomposed back to CO2 through plant and soil
inorganic dissolved carbonates that remain stored in soils or are exported to rivers. (b) The transformations of organic to inorganic carbon through decomposition and photosynthesis continue in rivers; here, CO2 will re-exchange with the atmosphere (“degassing”) or be converted to dissolved carbonates. These carbonates do not exchange with the atmosphere and are mainly exported to the coastal ocean. Organic carbon is also exported to the ocean or stored in
still continue. Solid organic carbon (such as soil particles and phytoplankton cells) is buried in coastal sediments, where it is stored or decomposes to inorganic carbon and diffuses back into coastal waters. Dissolved inorganic and organic carbon is also exported to the open ocean, and possible deep-ocean waters, where they are stored for many centuries.
FIGURE 9-17 Spatially integrated sequences of monthly carbon dioxide evasion for the respective hydrographic environments. Lines represent the best estimate of long-term means, whereas shaded regions represent the 67% confidence interval for the range of values likely in a particular year. The upper confidence limit for streams, hidden from view, extends nearly to the upper limit for the mainstem floodplain. FIGURE 9-16 Flooded area of the central Amazon Basin at high water, as mapped from the Japanese Earth Resources Satellite radar data (May to June 1996). The flooded area is shown as light areas in dark inset (the study quadrant). Underlying the inundation image is a digital river network (derived from the Digital Chart of the World, the GTOPO30 digital elevation model, and ancillary cartographic information). Major tributaries are labeled: Negro (Ng), Japurá (Jp), Içá (Ic), Solimöes (Sol, the Amazon mainstem exiting Peru), Jutaí (Jt), Juruá (Jr), Purus (Pr), Madeira (Md), and Tapajós (Tp).
PLATE 9-11 Outgassing by some tropical rivers reduces the efficacy of forests as carbon sinks. PLATE 9-12 FLANNELMOUTH CHARACIN (PROCHILODUS MARIAE)
FIGURE 9-18 Interannual variation in organic carbon flux. Whole-stream flux of suspended particulate
Prochilodus biomass (as wet mass). Y97 indicates 1997 data; Y98, 1998 data; and so on, to Y2K, 2000 data. FIGURE 9-19 Photographs of the split-stream removal
section of Rio las Marías. (b) Visual differences in benthic particulate matter after removing P. mariae (right) compared with the intact fish assemblage (left).
FIGURE 9-20 Map of the study areas and distribution of one tree species, as an example. Location of the study plots along the Panama Canal. The Cocoli plot on the dry Pacific side (upright solid triangle), the Sherman plot on the wet Atlantic side (inverted solid triangle), the 50-hectare forest dynamics plot on BCI (solid square), and the 119 additional inventory sites (circles) are shown. FIGURE 9-21 Significant relationships between drought sensitivity of seedlings and regional and local distributions of species. (a) and (c) Regional distributions of tree and shrub species were assessed as (a) the density in a plot at the dry Pacific relative to the wet Atlantic side of the Isthmus of Panama and (c) as the probability of
based on data from 122 inventory sites. (Note that the results were similar when omitting the two outlying species in [c].) (b) and (d) Local habitat affinities with topographic units within the 50-hectare forest dynamics plot on BCI were assessed for seedlings (b) and adults (d) as the density of a species in dry plateau sites relative to wet slope and streamside habitats. Drought sensitivity was experimentally assessed as the relative survival difference between dry and irrigated conditions.
FIGURE 9-22 Spatial patterns of July to September 2005 standardized anomalies in (a) precipitation (derived from Tropical Rainfall Measuring Mission satellite observations during 1998–2006) and in (b) forest canopy “greenness” (the EVI derived from MODIS satellite observations during 2000–2006). (c) Frequency distribution of EVI anomalies from intact forest areas in (b) that fell within the drought area, significantly (P < 0.001) skewed toward greenness.
FIGURE 9-23 Above-ground biomass change in the Amazon Basin and contiguous lowland moist forests. The 2005 drought reversed a multidecadal biomass carbon sink across Amazonia. Symbols represent magnitude and direction of measured change and approximate location of each plot. (a) Annual above- ground biomass, 2005 versus pre-2005, for those plots monitored throughout. Grayscale shading in (a) and (b) represents proportion of area covered by
as measured from space using radar-derived rainfall data (Tropical Rainfall Measuring Mission [TRMM]).
FIGURE 9-24 The relationships between net primary productivity and (a) mean annual precipitation and (b) mean annual temperature. Open squares are International Biological Program sites, open circles represent the tropical forests survey, and dark circles are sites on the Maui moisture gradient that varied in precipitation (MAP 2,000 to 5,050 millimeters) but not in temperature (MAT 16). PLATE 9-13 In some tropical forests, precipitation may reduce NPP.
FIGURE 9-25 Location and consistency of observed changes with warming. Locations of significant changes in physical systems (snow, ice, and frozen ground as well as hydrology and coastal processes) and biological systems (terrestrial, marine, and freshwater biological systems), and linear trends of surface air temperature (HadCRUT3) between 1970 and 2004. Note that there are overlapping symbols in some
East.
FIGURE 9-26 Ecosystem attributes in relation to mean annual temperature (MAT) in mature moist tropical evergreen forests: (a) fine- litter production increased significantly with MAT; (b) mean annual above-ground biomass increment (ABI) increased significantly with MAT; (c) below-ground carbon allocation (BCA) increased significantly with MAT; and (d) above- ground (Agnd) plant biomass increased significantly with MAT.
FIGURE 9-27 (a) Mortality and (b) recruitment rates (SEM) for increasing and decreasing genera. Data are shown for all trees (blue bars), for 13 genera that increased in basal area (brown bars), and for 13 genera that declined in density (green bars). Overall mortality (t 2.38, d.f. 17, P 0.03) and recruitment (t 4.45, d.f. 17, P 0.0003) accelerated from interval 1 (around 1984–1991) to interval 2 (around 1992–1999). However, there was no significant change over time (P < 0.11) in mortality or recruitment for the increasing and decreasing genera (paired t-tests).
PLATE 9-14 Changes in the abundances of lianas, many of which grow in deep shade, have characterized various tropical forests in recent years. FIGURE 9-28 Structural importance of lianas over 10 centimeters in diameter in each Neotropical site as a function of date of first inventory. (a) Liana stem density in stems per
to the north; northwest South America is the Chocó bioregion, west of the Andes; Amazonia is the Amazon River Basin and contiguous forested zones of Guiana and eastern Brazil. Linear regressions are fitted to the Amazonian data.
FIGURE 9-29 (a) Proportion of species in each of the four groups subject to decline or disappearance in the lowlands (biotic attrition), faced by gaps between current and projected elevational range (range-shift gaps), and exposed to mountaintop extinction, given a 600-meter upslope shift in all ranges. Proportions sum to greater than 1 because some species belong in two categories. (b) Cumulative number of species facing each of these three challenges as a function of warming-driven range shifts. The x axis represents model parameter , measured in meters of elevation range shift, on a continuous scale of warming-driven isotherm shifts of up to 5°C (nearly 1,000 meters), the upper range of projections for Central America for this century. The stairstep patterns are a consequence of sampling at discrete sites on the gradient.
PLATE 9-15 SILVER PHEASANT (LOPHURE NYCTHEMERA)