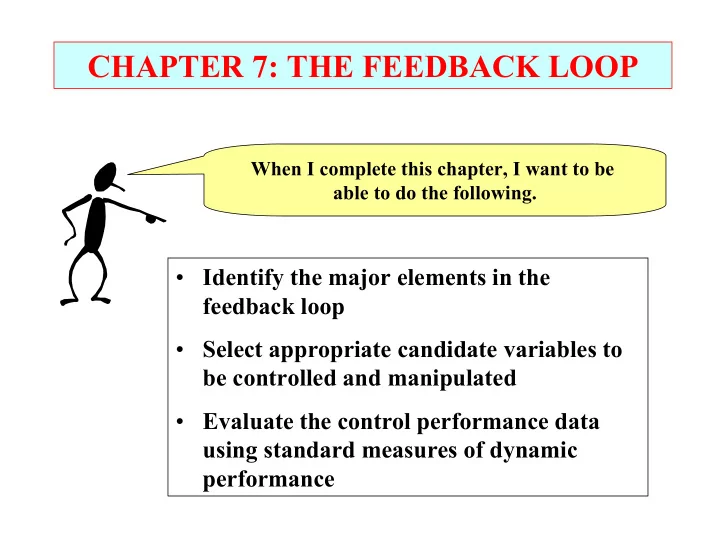
SLIDE 1 CHAPTER 7: THE FEEDBACK LOOP
When I complete this chapter, I want to be able to do the following.
- Identify the major elements in the
feedback loop
- Select appropriate candidate variables to
be controlled and manipulated
- Evaluate the control performance data
using standard measures of dynamic performance
SLIDE 2 Outline of the lesson.
- Typical loop elements
- Relating variables to control objectives
- Examples
- Typical control performance measures
- Five approaches to feedback control
CHAPTER 7: THE FEEDBACK LOOP
SLIDE 3
CHAPTER 7: THE FEEDBACK LOOP
TC A
v1 v2
The Concept: We show limited detail in the piping and instrumentation (P&I) drawing. We see the sensor location, variable measured, connection to the final element (valve) and the location of the final element.
SLIDE 4 CHAPTER 7: THE FEEDBACK LOOP
T A v1 v2
The Reality: Many elements in the loop affect the safety, reliability, accuracy, dynamics and cost. Engineers need to understand the details!
4-20 mA 4-20 mA 3-15 psi
SLIDE 5 CHAPTER 7: THE FEEDBACK LOOP
Sensor & transmitter electronic transmission input and A/D conversion computing network electronic transmission I/P conversion pneumatic transmission final element
THE PROCESS
Make a step (without feedback control) What affects the response to the computer?
and D/A
SLIDE 6
CHAPTER 7: THE FEEDBACK LOOP
Class exercise: Given the following dynamics, sketch the responses for a step in manual station to the displayed value.
SLIDE 7
CHAPTER 7: THE FEEDBACK LOOP
Class exercise: Given the following dynamics, sketch the responses for a step in manual station to the displayed value. What you see (from the display) is not always what is occurring!!
SLIDE 8
CHAPTER 7: THE FEEDBACK LOOP
The engineer must decide what measurement to control and what valve to adjust (and provide the equipment to support the decisions).
SLIDE 9
CHAPTER 7: THE FEEDBACK LOOP
The engineer must decide what measurement to control and what valve to adjust (and provide the equipment to support the decisions). CV to control ? Use seven categories of control objectives!
control objective process variable sensor 1) Safety 2) Environmental protection 3) Equipment protection 4) Smooth plant operation and production rate 5) Product quality Concentration of reactant A in the effluent Analyzer in reactor effluent measuring the mole % A 6) Profit optimization 7) Monitoring and diagnosis
SLIDE 10
CHAPTER 7: THE FEEDBACK LOOP
The engineer must decide what measurement to control and what valve to adjust (and provide the equipment to support the decisions).
MV to adjust ?
1. Causal relationship 2. Automated 3. Fast dynamics 4. Compensate for large disturbances 5. Can adjust quickly with little adverse affect on process performance
SLIDE 11
CHAPTER 7: THE FEEDBACK LOOP
The engineer must decide what measurement to control and what valve to adjust (and provide the equipment to support the decisions).
Input variables that affect the measured variable Selected adjustable flow Manipulated valve Feed temperature Solvent flow rate Feed composition, before mix disturbances Coolant inlet temperature Flow of pure A Flow of pure A vA adjustable Flow of coolant
We could use either valve. We will revisit this choice later (Chapter13)
SLIDE 12
CHAPTER 7: THE FEEDBACK LOOP
The figure shows the feedback loop We’ll see the calculation in the next chapter. Explain, including the feedback concept.
SLIDE 13 FT 1 FT 2 PT 1 AT 1 TI 1 TI 2 TI 3 TI 4 PI 2 PI 3 PI 4 TI 5 TI 6 TI 7 TI 8 TI 9 FI 3 TI 10 TI 11 PI 5 PI 6
Class exercise on the feedback loop: Using the methods just described, select ONE variable to be controlled and for that variable, ONE valve to be manipulated.
feed air fuel Flue gas
burner
SLIDE 14 FT 1 FT 2 PT 1 AT 1 TI 1 TI 2 TI 3 TI 4 PI 2 PI 3 PI 4 TI 5 TI 6 TI 7 TI 8 TI 9 FI 3 TI 10 TI 11 PI 5 PI 6
Class exercise on the feedback loop: Using the methods just described, select ONE variable to be controlled and for that variable, ONE valve to be manipulated.
feed air fuel Flue gas
burner
AC
O2
SLIDE 15 CHAPTER 7: THE FEEDBACK LOOP
Music: “I cannot define good music, but I know what I like.” Control Performance: We must be able to define what we desire, so that we can design equipment and controls to achieve our objectives.
5 10 15 20 25 30 35 40 45 50 0.5 1 1.5 Time Controlled Variable 5 10 15 20 25 30 35 40 45 50 0.5 1 1.5 2 Time Manipulated Variable
Controlled variable, value from a sensor Manipulated variable, usually a valve Set point entered by person
SLIDE 16 5 10 15 20 25 30 35 40 45 50 0.5 1 1.5 2 Time Manipulated Variable 5 10 15 20 25 30 35 40 45 50 0.5 1 1.5 Time Controlled Variable
CHAPTER 7: THE FEEDBACK LOOP
Let’s be sure we understand the variables in the plot. We will see this plot over and over and over …!
SLIDE 17 CHAPTER 7: THE FEEDBACK LOOP Set point Change
5 10 15 20 25 30 35 40 45 50 0.5 1 1.5 Time 5 10 15 20 25 30 35 40 45 50 0.5 1 1.5 2 Time
= IAE = ⌠ ⌡ |SP(t)-CV(t)| dt
Return to set point, “zero offset Rise time
D B
B/A = Decay ratio
C/D = Maximum overshoot of manipulated variable
C A
∞
SLIDE 18 CHAPTER 7: THE FEEDBACK LOOP Disturbance Response
100 200 300 400 500 600 700 800 900 1000
10 20 S-LOOP plots deviation variables (IAE = 5499.9786) Time Controlled Variable 100 200 300 400 500 600 700 800 900 1000
10 20 Time Manipulated Variable
Variance or standard deviation of CV Variance or standard deviation of MV
Often, the process is subject to many large and small disturbances and sensor noise. The performance measure characterizes the variability.
SLIDE 19 CHAPTER 7: THE FEEDBACK LOOP Disturbance Response
5 10 15 20 25 30 35 40 45 50
0.2 0.4 0.6 0.8 Time 5 10 15 20 25 30 35 40 45 50
Time
= IAE = |SP(t)-CV(t)| dt
Maximum CV deviation from set point
⌠ ⌡
∞