
SLIDE 1
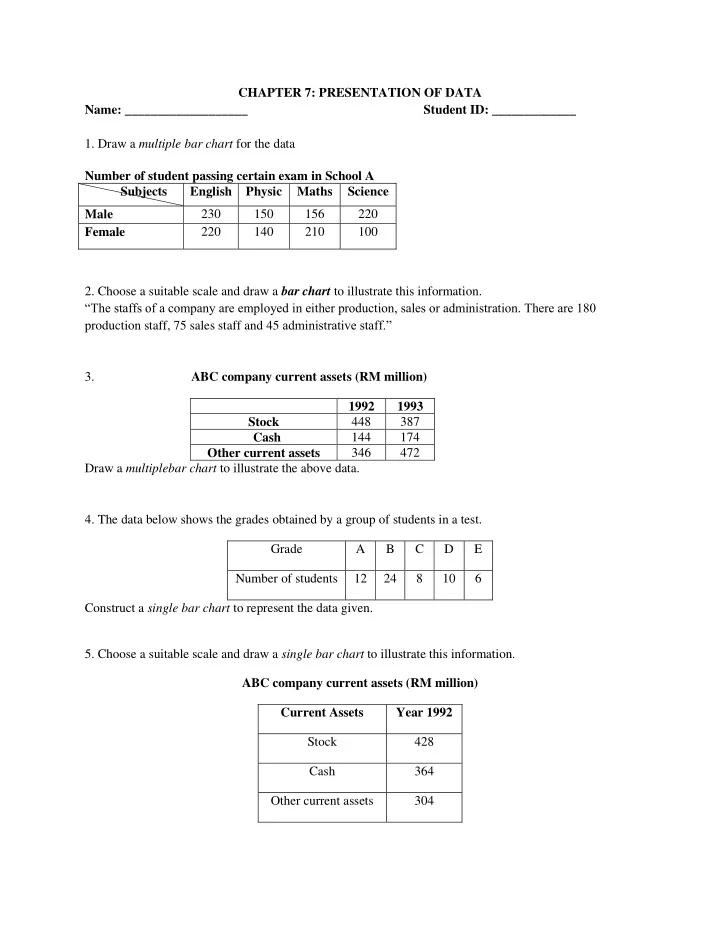
CHAPTER 7: PRESENTATION OF DATA Name: ___________________ Student ID: _____________
- 1. Draw a multiple bar chart for the data
Number of student passing certain exam in School A Subjects English Physic Maths Science Male 230 150 156 220 Female 220 140 210 100
- 2. Choose a suitable scale and draw a bar chart to illustrate this information.
“The staffs of a company are employed in either production, sales or administration. There are 180 production staff, 75 sales staff and 45 administrative staff.” 3. ABC company current assets (RM million) 1992 1993 Stock 448 387 Cash 144 174 Other current assets 346 472 Draw a multiplebar chart to illustrate the above data.
- 4. The data below shows the grades obtained by a group of students in a test.
Grade A B C D E Number of students 12 24 8 10 6 Construct a single bar chart to represent the data given.
- 5. Choose a suitable scale and draw a single bar chart to illustrate this information.