SLIDE 1 Chapter 7: Physiological Sensing
One of the interesting trends in the last several years is the explosion of wearable sensors that measure different physiological signals including cardiac rhythms, breathing, sweat, brain waves, gestures, muscular contractions, eye movements, and many others. For example, there’s the Melon headband that measures focus by monitoring brain waves, the Basis wristband that measures heart rate, skin temperature, and sleep, the Myo armband that measures muscular activity to detect gestures, the iHealth pulse oximeters, and many others. Indeed, in the next several years, we might well reach a point where health sensors are integrated into clothing, jewelry, and many other accessories. In this chapter, we are going to look at a few physiological signals, and discuss what they measure, and what features are useful.
Electrocardiogram (ECG)
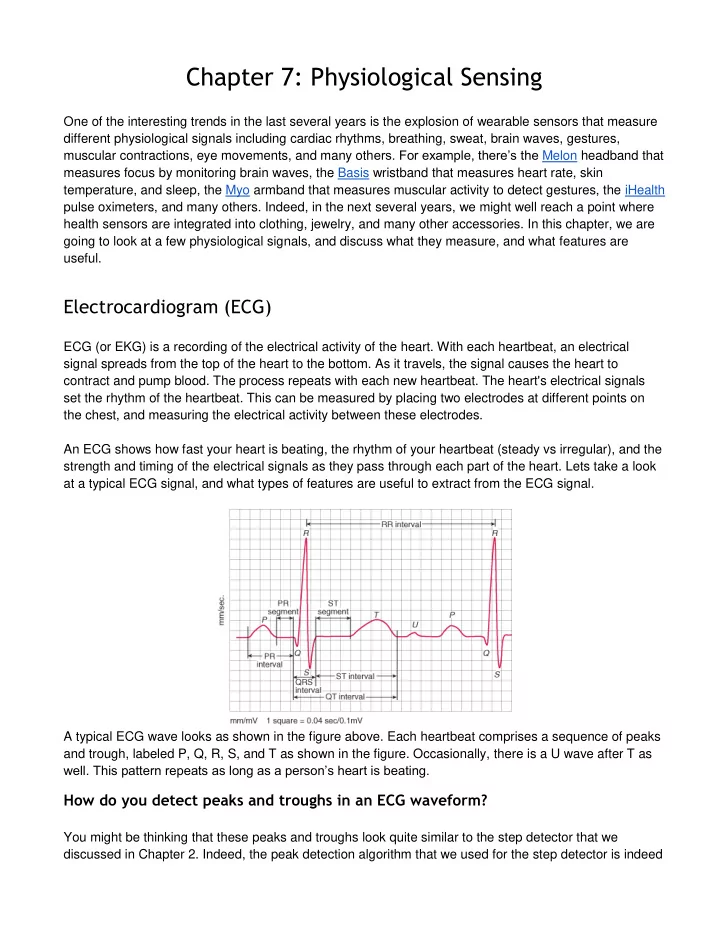
ECG (or EKG) is a recording of the electrical activity of the heart. With each heartbeat, an electrical signal spreads from the top of the heart to the bottom. As it travels, the signal causes the heart to contract and pump blood. The process repeats with each new heartbeat. The heart's electrical signals set the rhythm of the heartbeat. This can be measured by placing two electrodes at different points on the chest, and measuring the electrical activity between these electrodes. An ECG shows how fast your heart is beating, the rhythm of your heartbeat (steady vs irregular), and the strength and timing of the electrical signals as they pass through each part of the heart. Lets take a look at a typical ECG signal, and what types of features are useful to extract from the ECG signal. A typical ECG wave looks as shown in the figure above. Each heartbeat comprises a sequence of peaks and trough, labeled P, Q, R, S, and T as shown in the figure. Occasionally, there is a U wave after T as
- well. This pattern repeats as long as a person’s heart is beating.
How do you detect peaks and troughs in an ECG waveform?
You might be thinking that these peaks and troughs look quite similar to the step detector that we discussed in Chapter 2. Indeed, the peak detection algorithm that we used for the step detector is indeed
SLIDE 2
a good starting point for detecting the peaks and troughs in ECG. As with step detection, you look for a change in the slope from positive to negative (peak) or negative to positive (trough). You then look at the sequence information to label the appropriate peaks (P, Q, R, S, T).
How to extract ECG features?
Once you have the five (or six) peaks and troughs, the timing differences between them are useful features for classification. For example, you can extract the RR interval, PR interval, the QRS interval, the QT interval, the ST interval, and so on, and look at how these intervals vary to detect abnormalities in the heart. Obtaining heart rate from ECG is quite straightforward once you have the RR interval. Each RR interval corresponds to the time between two successive heartbeats, so you just need to compute the number of RR intervals in one minute, which is 𝐼𝑆 = 60 ÷ 𝑆𝑆 (when RR is measured in seconds). You can also measure the breathing rate from heart rate information, but we will discuss this further when we talk about photoplethysmography (PPG) in the next section.
Photoplethysmography (PPG)
Photoplethysmography is a non-invasive technique for measuring blood volume changes in the blood vessels close to the skin. PPG has become a popular non-invasive method for extracting physiological measurements such as heart rate and oxygen saturation. PPG is typically measured by a device called a pulse oximeter, that is worn like a cap on the index finger (on the left below). But what makes PPG particularly appealing is that it can be measured using a built-in cellphone camera without any additional hardware. Well, almost no additional hardware, since its often useful to have a cap as shown on the right below to block out ambient light. By placing the index finger over the cellphone camera with its flash turned on, the camera records the light absorbed by the finger tissue. Then, from the video, each frame is processed by splitting every pixel into red, green and blue (RGB) components, which are then processed to extract heart rate and breathing rate. There are many apps that are available on the Android Store and iOS App Store that use photoplethysmography --- some examples are Whats my Heart Rate, which is an Android App, and Instant Heart Rate and Cardiograph, which are iPhone apps. Lets take a look at how these apps work.
SLIDE 3 How to extract Heart Rate (HR) from PPG?
During the cardiac cycle, when the heartbeats, it creates a wave of blood that reaches the capillarity at the tip of the finger, when the capillarity is full of blood, less light passes through and the finger. When the blood retracts, more light can pass through the tissue. If these changes are recorded over time, a waveform is going to be created that correspond to the pulsatile changes in the arterial blood in that
- tissue. These changes in the arterial blood volume correspond to the heart rate. This process is known
as PPG. Using the method described above we try to detect the cardiac waveform and from that the heart rate. Heart rate estimation from the signal is as follows. From the recorded video, the green values from every frame were extracted in order to acquire the PPG signal. The green intensity average in the PPG signal formed peaks that correspond to cardiac pulse. A peak detection algorithm was used in order to find all the cardiac peaks in the signal. A peak is defined as the highest average of green values in a fixed window size (typically ~0.7 seconds). Once a peak was found, the time difference between consecutive peaks was computed. This time difference is known as R-R interval (RRI). From the R-R interval values the HR was estimated using the following formula: 𝐼𝑆 = 60 ÷ 𝑆𝑆
How to extract Breathing Rate (BR) from PPG?
Interestingly, the PPG signal can be used for extracting not just the heart rate but also the breathing rate
- f the individual. The reason why this is possible is because of a phenomenon called Respiratory sinus
arrhythmia (RSA), which is a naturally occurring variation in heart rate that occurs during a breathing
- cycle. Heart rate increases during inspiration and decreases during expiration! Were you aware of this?
We will skip the biological reasons for RSA, and focus on how to extract breathing rate from PPG. To view this behavior in a real dataset, focus on the blue curve in the figure below (ignore the red curve for now). The blue curve plots the average green intensity per frame. As we expected, the green intensity goes up and down for each heartbeat. But you can also see that there is another periodic pattern that is visible --- the green intensity for each heartbeat is not identical, in fact the green intensity seems seems to spike every few heartbeats and go down after that. This pattern is caused by RSA as described earlier
SLIDE 4
- - the R-R interval on an ECG is shortened during inhalation and prolonged during exhalation.
How do we go about extracting the respiration rate (RR)? Recall that we are now looking for the frequency of changes in the heart rate. Whenever we want frequency domain information, we use an FFT to convert from time to frequency domain, and take the dominant frequency from the FFT. This is exactly what we do to obtain the respiration rate from the PPG signal. That completes our analysis of how PPG can be used to extract heart rate and breathing rate. To summarize, a) first, we get the average green intensity per frame, b) second, we use peak detection on a short window of samples to extract the RR interval, and from that obtain the HR, and c) third, we perform an FFT on the RR intervals obtained in step (b) to obtain the RR. The only thing left for you to do is to try this out on your smartphone!
Electrodermal Activity (EDA)
Electrodermal activity refers to electrical changes measured at the surface of the skin that arise when the skin receives innervating signals from the brain. When most people experience emotional arousal, increased cognitive workload or physical exertion, the brain sends signals to the skin to increase the level of sweating. The person may not feel any sweat on the surface of the skin, but the electrical conductance increases in a measurably significant way as the pores begin to fill below the surface. One of the key aspects of EDA is that it results from sympathetic neuronal activity i.e. its a neural response that cannot be controlled consciously by an individual. It is the only physiological parameter that is not affected by the cognitive processes of an individual! For example, you can slow your heart rate down by taking deep breaths, but you cannot consciously change the electrodermal response. As a result, EDA can be used to examine implicit emotional responses that may occur without conscious awareness or are beyond cognitive intent. This is one of the key reasons why it is widely used as a lie detector and for understanding emotion.
EDA features
SLIDE 5 There are two main components to the overall complex referred to as EDA. One component is the general tonic-level EDA which relates to the slower acting components and background characteristics of the signal (slow climbing, slow declinations
- ver time). The most common measure of this component is the Skin Conductance Level
(SCL) and changes in the SCL are thought to reflect general changes in autonomic arousal. The other component is the phasic component and this refers to the faster changing elements of the signal - the Skin Conductance Response (SCR). This generally corresponds to sudden events -- for example, if you are startled, that can create an SCR. Thus, while SCL changes over the course of minutes, SCR changes over the course of seconds. A typical SCR is shown in the figure on the right. The SCR can be sub-divided into several features that are useful for classification.
- latency, which is the amount of time between the
stimulus and the rise of the wave.
- rise time, how long it takes for the skin
conductance to shoot up to it's peak.
- amplitude is the height of the SCR.
- half recovery time is the amount of time it takes
for the wave to fall back to half it's amplitude. The SCL is the background signal in the absence of an SCR. To obtain this measure, a small window of EDA samples is selected where there is no SCR present. From this window, the SCL level is just the average value of EDA.
Electroencephalography (EEG), Electromyography (EMG), and Others
We have discussed a few physiological signals, but these are no means the only ones. There are many
- ther signals that are very useful and have numerous applications.
For example, EEG signals are recordings of brain signals. While EEG is traditionally captured by using a huge array of electrodes on the scalp (head), there have been many recent EEG headbands that require fewer electrodes and capture a subset of EEG signals. These signals can be useful in various ways. For example, the figure on the right shows EEG signals when an individual is aroused, relaxed, asleep and in deep sleep state. Clearly, these signals are very different, and using time-domain and frequency-domain techniques such as those you have seen, one might be able to extract features from the signal and classify them into the different states. Another interesting signal is EMG, which captures the electrical signal produced by skeletal muscles. There are some very interesting applications of this measure. For example, an
SLIDE 6 armband worn below the elbow that measures EMG can be detect various gestures from your fingers, thereby enabling gesture-based interaction with computers and video games, or perhaps interaction with your home like switching on/off light bulbs by flicking your fingers. In conclusion, there are a wide range of physiological signals that can be measured using wearable
- sensors. As these sensors become commonplace, our ability to continuously measure these signals has
grown, leading to new opportunities to take advantage of them in our daily lives.
References
Skin conductance for measuring mental state - Course project A Guide for Analysing Electrodermal Activity (EDA) & Skin Conductance Responses (SCRs) for Psychological Experiments - Jason J Braithwaite, Derrick G Watson, Robert Jones, Mickey Rowe Extracting Heart Rate and Respiration Rate using a Cell Phone Camera - Jimenez, Parnandi, Gutierrez- Osuna