SLIDE 1
Chapter 26: Tests of Significance
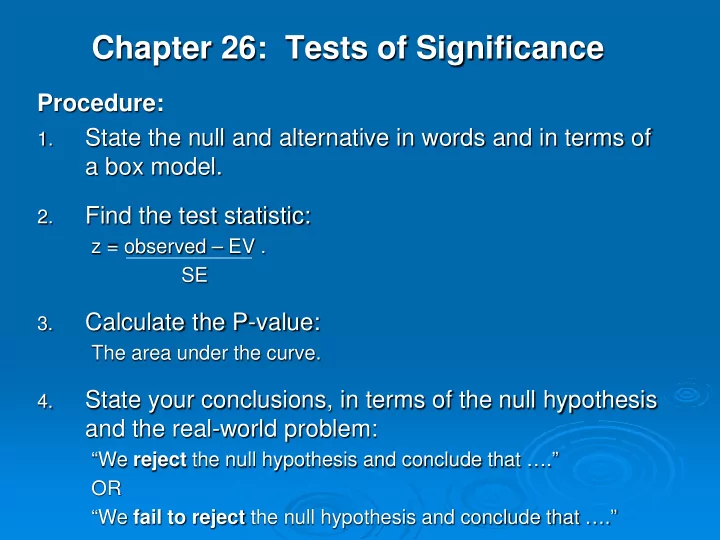
Procedure:
1.
State the null and alternative in words and in terms of a box model.
2.
Find the test statistic:
z = observed – EV . SE
3.
Calculate the P-value:
The area under the curve.
4.
State your conclusions, in terms of the null hypothesis and the real-world problem:
“We reject the null hypothesis and conclude that ….” OR “We fail to reject the null hypothesis and conclude that ….”
SLIDE 2
Example 1. A croupier thinks a roulette wheel is biased towards reds. He keeps track of the next 1000 tosses and finds that he gets 508 reds. Is this evidence that the croupier is correct, or could this result just be due to chance error?
SLIDE 3 Notes on the null
The null hypothesis is the “status quo” or “default” hypothesis. It’s what we would tend to believe if we did not have data. The data are collected to see whether this hypothesis is reasonable or not. The null hypothesis will always make a definite statement about the
- box. e.g. “the average is equal to 2.5” NOT “the average is greater than
2.5”. If there is a standard to which we are comparing, then the null hypothesis would say that the standard is met. If there is a population to which we are comparing, then the null hypothesis would say that the sample is like a sample from that population. In other cases, the null hypothesis is that some chance model is true. Usually (but not always) the purpose of the test is to reject the null, because then we can say something interesting.
SLIDE 4
Notes on the box
For 0/1 boxes, the null determines the number of 0s and 1s, from which we get the average and SD of the box. For chance models, the null determines what tickets go in the box, from which we get the average and SD of the box. For a box with continuous data, the null hypothesis determines the average of the box, but we need to use the SD of the sample to estimate the SD of the box (bootstrap).
SLIDE 5
Example 2. A class of _____ students is studied to find out if they have “ESP”. They are told that one of the numbers 1,2,3,4 is in an envelope and asked to guess which number it is, using any “ESP” powers they might have. Of the _____ students, _____ get the correct answer. Is this evidence that they are not just guessing at random? Is it evidence of “ESP”?
SLIDE 6
Notes on the P-value
We reject the null hypothesis if the P-value is small. How small? Less than 5% is “statistically significant” Less than 1% is “Highly statistically significant” The P-value is the chance of getting a sample value or test statistic at least as weird as the one we got, if the null hypothesis were true. The P-value is called the “observed significance level”. The P-value is NOT the chance that the null hypothesis is true – it’s the chance of us seeing DATA as far away as what we saw, if the null hypothesis were true, so if the P- value is small, we tend to believe the null is not true.
SLIDE 7
Calculating the P-value
SLIDE 8 Example 3. Bottles of orange juice are supposed to have 16 fluid
- unces. A random sample of 100 bottles from a large batch contains an
average of 15.7 ounces with an SD of 0.2 ounces. Test the hypothesis that the bottles are being filled correctly, against the alternative that they are not full enough.
SLIDE 9
Example 4. 400 people are each given a soda and a diet soda and asked to identify the diet soda. 283 correctly identify the diet soda. Is this evidence that people can tell the difference, or could they just be guessing?
SLIDE 10
Two-tailed tests
If we have a suspicion, before we do the experiment or take the sample, that the alternative hypothesis will be only in one direction, then we do a 1-tailed test.
Null: the average of the box is 25. Null: the average of the box is 25 Alt: the average is less than 25. Alt: the average is more than 25.
If we don’t know in which direction it will go, then we should do a 2-tailed test.
Null: the average of the box is 25. Alt: the average is NOT 25.
SLIDE 11
Example 5. National data suggest that 25% of Caucasians have a certain gene. To see whether Cache Valley people are similar to the nation with respect to this gene, a researcher takes a simple random sample of 200 people and finds that 39 of them have the gene. Is this evidence that Cache Valley people are different from the nation with respect to this gene?
SLIDE 12 The t-test
The t-test is used when
- the number of draws is small
- the SD of the box is estimated using the data
- the tickets in the box follow the normal curve.
It’s similar to the z-test except:
- 1. Use the SD+ instead of the SD:
SD+ = √ SD
t = observed – EVave . SEave
- 3. Degrees of freedom: df = number of draws – 1.
- 4. Use the t-tables to get the p-value.
SLIDE 13
The t curve
SLIDE 14
Example 6. An English exam is taken by 2000 students. The exam scores are known to follow the normal curve. The teacher says that the population average of all 2000 test scores is 75, but one of the students thinks the population average is actually lower. She takes a simple random sample of 9 students and finds they got the following scores: 63, 53, 84, 82, 35, 50, 68, 73, 92 Test to determine whether the population average really is 75, against the alternative that the student is correct. You should clearly state the null and the alternative hypothesis, find a test statistic and an approximate P-value, and state your conclusions in everyday language.
SLIDE 15
Example 7. Tomatoes of a certain quality are supposed to have an average weight of 5.0 ounces. I'm a little skeptical - I think the average is somewhat greater than 5.0 ounces. I select 10 tomatoes at random and find that the average weight of these 10 tomatoes is 5.79 ounces with an SD of .91 ounces. Is there evidence that the average weight of this type of tomato is greater than 5.0 ounces?