
SLIDE 1
Chapter 08
Trophic Dynamics in Evolutionary Context
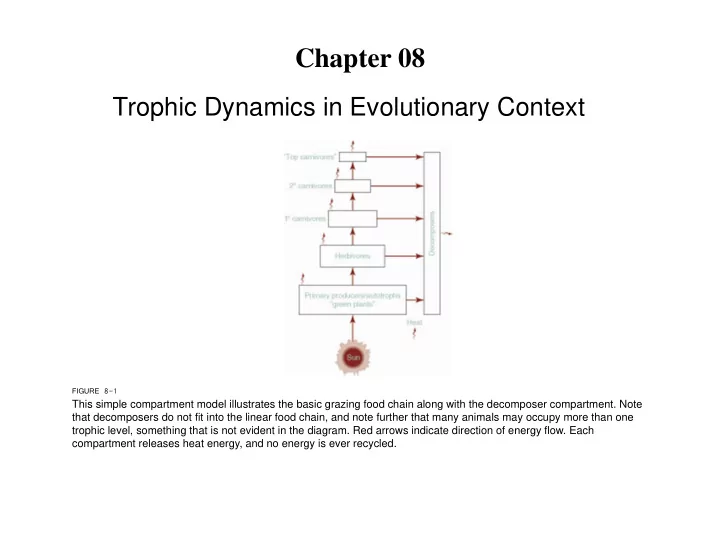
FIGURE 8-1 This simple compartment model illustrates the basic grazing food chain along with the decomposer compartment. Note that decomposers do not fit into the linear food chain, and note further that many animals may occupy more than one trophic level, something that is not evident in the diagram. Red arrows indicate direction of energy flow. Each compartment releases heat energy, and no energy is ever recycled.