
SLIDE 1
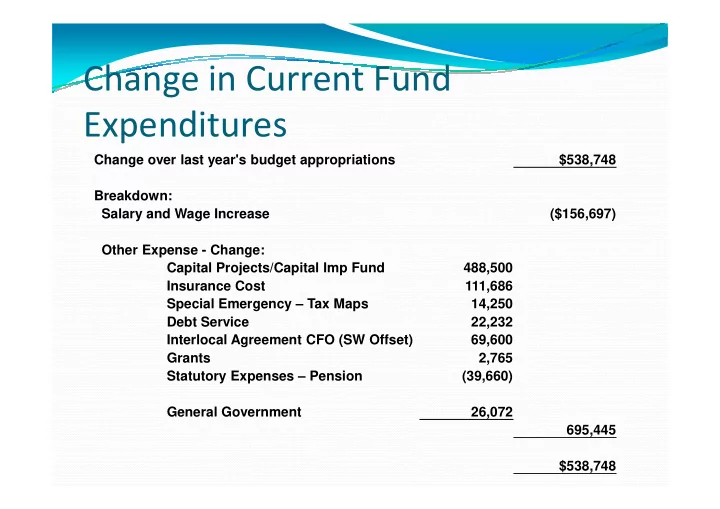
Change over last year's budget appropriations $538,748 Breakdown: Salary and Wage Increase ($156,697) Other Expense - Change:
Change in Current Fund Expenditures
Other Expense - Change: Capital Projects/Capital Imp Fund 488,500 Insurance Cost 111,686 Special Emergency – Tax Maps 14,250 Debt Service 22,232 Interlocal Agreement CFO (SW Offset) 69,600 Grants 2,765 Statutory Expenses – Pension (39,660) General Government 26,072 695,445 $538,748