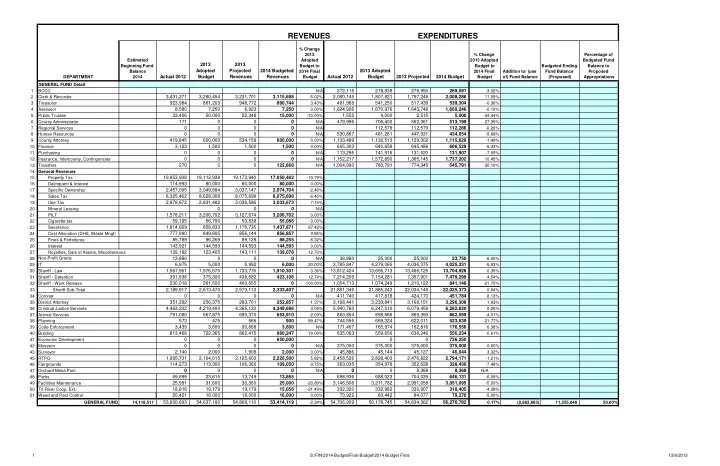

SLIDE 1
REVENUES EXPENDITURES
DEPARTMENT Estimated Beginning Fund Balance 2014
Actual 2012 2013 Adopted Budget 2013 Projected Revenues 2014 Budgeted Revenues
% Change 2013 Adopted Budget to 2014 Final Budget
Actual 2012 2013 Adopted Budget 2013 Projected 2014 Budget
% Change 2013 Adopted Budget to 2014 Final Budget Addition to/ (use
- f) Fund Balance
Budgeted Ending Fund Balance (Proposed) Percentage of Budgeted Fund Balance to Proposed Appropriations GENERAL FUND Detail 1 BOCC N/A
272,116 278,839 276,950 269,591
- 3.32%
2 Clerk & Recorder
3,431,271 3,280,454 3,231,701 3,115,688
- 5.02%
2,080,145 1,807,821 1,797,248 2,008,286
11.09% 3 Treasurer
923,984 861,203 948,772 890,744
3.43%
481,969 541,250 517,439 539,304
- 0.36%
4 Assessor
8,580 7,250 6,923 7,250
0.00%
1,624,926 1,670,976 1,643,748 1,669,246
- 0.10%
5 Public Trustee
33,406 50,000 22,348 15,000
- 70.00%
1,552 9,000 2,515 5,000
- 44.44%
6 County Administrator
171
N/A
479,996 706,400 562,361 513,199
- 27.35%
7 Regional Services N/A
112,579 112,579 112,286
- 0.26%
8 Human Resources N/A
530,867 481,261 447,931 434,654
- 9.68%
9 County Attorney
419,845 600,000 534,158 600,000
0.00%
1,133,489 1,132,513 1,129,302 1,115,629
- 1.49%
10 Finance
3,123 1,500 1,500 1,500
0.00%
605,303 640,658 645,486 606,529
- 5.33%
11 Purchasing N/A
113,256 141,916 131,520 131,907
- 7.05%
12 Insurance, Intercounty, Contingencies N/A
1,152,217 1,572,890 1,365,145 1,737,202
10.45% 13 Transfers
270 122,868
N/A
1,064,990 780,791 774,345 545,791
- 30.10%
14 General Revenues 15 Property Tax
19,853,938 19,112,938 19,173,940 17,050,462
- 10.79%
16 Delinquent & Interest
114,993 80,000 80,000 80,000
0.00% 17 Specific Ownership
2,457,095 3,049,584 3,037,147 2,974,704
- 2.46%
18 Sales Tax
8,325,462 8,628,308 8,075,698 8,075,698
- 6.40%
19 Use Tax
2,878,672 2,831,482 3,039,586 3,033,673
7.14% 20 Mineral Leasing N/A 21 PILT
1,578,211 3,206,702 3,127,674 3,206,702
0.00% 22 Cigarette tax
59,195 56,790 53,838 55,086
- 3.00%
23 Severance
1,814,669 858,833 1,176,735 1,437,871
67.42% 24 Cost Allocation (DHS, Waste Mngt)
777,990 849,605 856,144 856,857
0.85% 25 Fines & Forfeitures
85,789 96,269 89,128 88,255
- 8.32%
26 Interest
143,921 144,593 144,593 144,593
0.00% 27 Royalties, Sale of Assets, Miscellaneous
139,182 123,405 143,111 139,078
12.70% 28 Non-Profit Grants
13,880
N/A
38,880 25,000 25,000 23,750
- 5.00%
29 IT
6,975 5,000 5,992 6,000
20.00%
3,785,847 4,279,065 4,036,375 4,025,331
- 5.93%
30 Sheriff - Law
1,567,961 1,976,670 1,733,776 1,910,301
- 3.36%
13,612,424 13,656,713 13,466,125 13,704,926
0.35% 31 Sheriff - Detention
391,938 375,300 438,682 423,106
12.74%
7,214,209 7,154,281 7,357,901 7,479,299
4.54% 32 Sheriff - Work Release
230,018 261,500 400,655
- 100.00%
1,054,713 1,074,249 1,210,122 841,148
- 21.70%
33 Sheriff Sub-Total
2,189,917 2,613,470 2,573,113 2,333,407 21,881,346 21,885,243 22,034,148 22,025,373
0.64% 34 Coroner N/A
411,740 417,818 424,170 451,784
8.13% 35 District Attorney
351,292 256,375 283,701 252,857
- 1.37%
3,198,441 3,233,841 3,168,151 3,296,308
1.93% 36 Criminal Justice Services
4,463,232 4,219,400 4,365,130 4,349,696
3.09%
5,940,760 6,247,510 6,079,459 6,262,820
0.25% 37 Animal Services
791,080 667,870 690,370 653,910
- 2.09%
863,854 898,666 869,393 862,599
- 4.01%
38 Planning
573 475 566 900
89.47%
744,556 669,324 622,011 523,639
- 21.77%
39 Code Enforcement
3,439 3,600 30,668 3,600
N/A
171,467 165,974 162,816 176,556
6.38% 40 Building
813,468 722,365 862,415 860,247
19.09%
635,063 559,656 638,246 556,234
- 0.61%
41 Economic Development
650,000 736,250
42 Museum N/A
375,000 375,000 375,000 375,000
0.00% 43 Surveyor
2,140 2,000 1,908 2,000
0.00%
45,886 45,144 45,127 46,644
3.32% 45 RTPO
1,995,731 2,104,015 2,125,603 2,226,500
5.82%
2,458,526 2,828,403 2,476,822 2,794,171
- 1.21%
46 Fairgrounds
114,273 113,300 106,360 109,050
- 3.75%
363,035 354,978 352,628 328,430
- 7.48%
47 Orchard Mesa Pool N/A
8,368 8,368
N/A 48 Parks
69,699 23,615 13,749 13,865 698,936 688,023 704,039 646,131
- 6.09%
49 Facilities Maintenance
25,991 31,600 30,360 25,000
- 20.89%
3,146,506 3,211,782 2,991,058 3,051,095
- 5.00%
50 Tri-River Coop. Ext.
18,816 19,179 19,179 15,058
- 21.49%
332,320 332,982 330,907 318,405
- 4.38%
51 Weed and Pest Control
20,421 16,000 16,000 16,000
0.00%
73,922 83,442 84,077 79,270
- 5.00%
GENERAL FUND 14,118,511
53,930,693 54,637,180 54,868,110 53,414,119
- 2.24%