
SLIDE 1
10/17/2013 1
CEE 697K
ENVIRONMENTAL REACTION KINETICS
Introduction
David A. Reckhow
CEE697K Lecture #10 1
Updated: 17 October 2013
Print version
Lecture #10
Special Topics: DCP in Water
Primary Literature (e.g., Guthrie & Cossar, 1986)
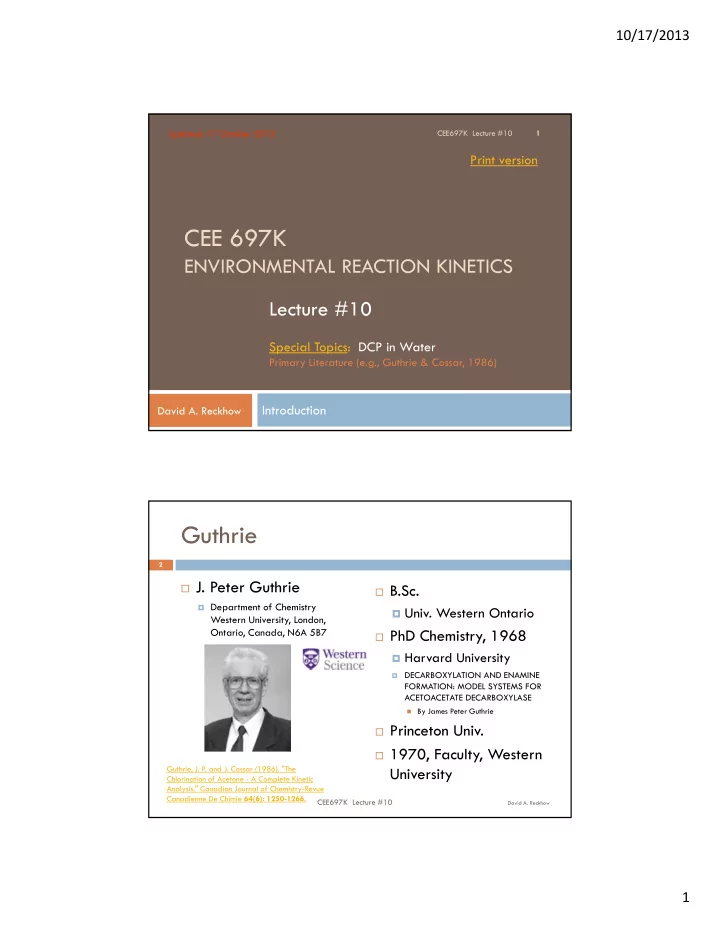
Guthrie
J. Peter Guthrie
Department of Chemistry
Western University, London, Ontario, Canada, N6A 5B7
B.Sc. Univ. Western Ontario PhD Chemistry, 1968 Harvard University
DECARBOXYLATION AND ENAMINE
FORMATION: MODEL SYSTEMS FOR ACETOACETATE DECARBOXYLASE
By James Peter Guthrie
Princeton Univ. 1970, Faculty, Western
University
David A. Reckhow
2
CEE697K Lecture #10 Guthrie, J. P. and J. Cossar (1986). "The Chlorination of Acetone - A Complete Kinetic Analysis." Canadian Journal of Chemistry-Revue Canadienne De Chimie 64(6): 1250-1266.