
SLIDE 1
CEE 680 Lecture #12 2/10/2020 1
Lecture #12 Acids & Bases: Graphical Solutions II Benjamin, Chapter 4
(Stumm & Morgan, Chapt.3 )
David Reckhow CEE 680 #12 1
Updated: 10 February 2020
Print version
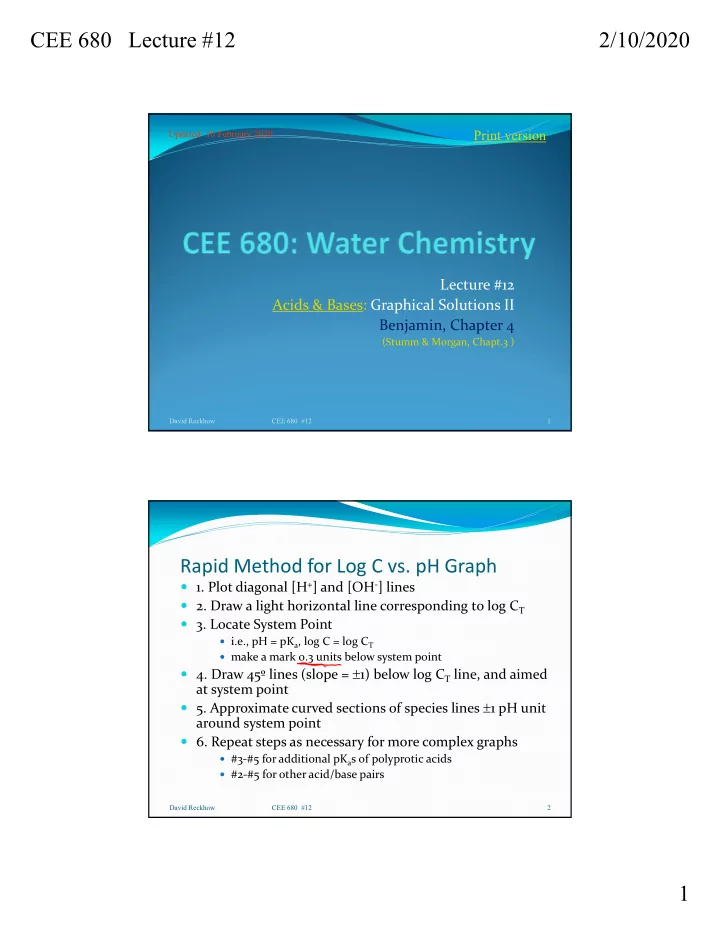
Rapid Method for Log C vs. pH Graph
1. Plot diagonal [H+] and [OH‐] lines 2. Draw a light horizontal line corresponding to log CT 3. Locate System Point
i.e., pH = pKa, log C = log CT make a mark 0.3 units below system point
4. Draw 45º lines (slope = 1) below log CT line, and aimed
at system point
5. Approximate curved sections of species lines 1 pH unit
around system point
6. Repeat steps as necessary for more complex graphs
#3‐#5 for additional pKas of polyprotic acids #2‐#5 for other acid/base pairs
David Reckhow CEE 680 #12 2