CDOTs Flood Recovery Program LOCAL AGENCY UPDATES September 18, - - PowerPoint PPT Presentation

cdot s flood recovery program local agency updates
SMART_READER_LITE
LIVE PREVIEW

CDOTs Flood Recovery Program LOCAL AGENCY UPDATES September 18, - - PowerPoint PPT Presentation

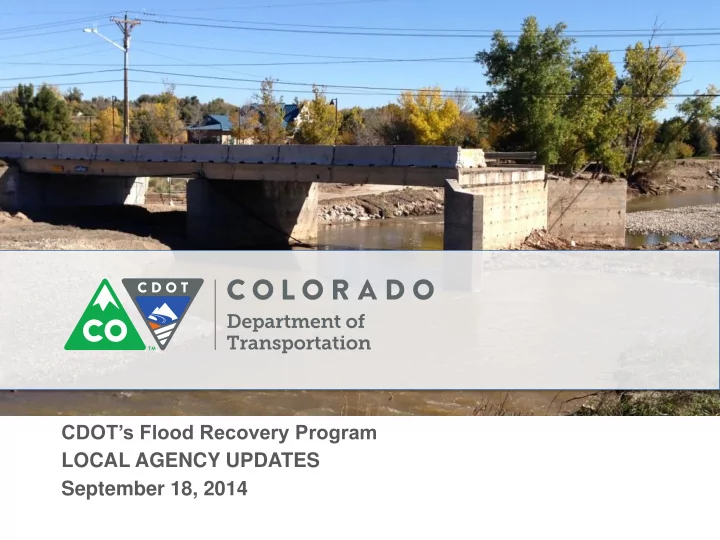
CDOTs Flood Recovery Program LOCAL AGENCY UPDATES September 18, 2014 AGENDA PR Task Order Process Construction DDIRs for Projects > $1 million Consultant DBE Goals Environmental Process Request for Reimbursement Q&A


slide-1
SLIDE 1

CDOT’s Flood Recovery Program LOCAL AGENCY UPDATES September 18, 2014

slide-2
SLIDE 2

AGENDA

  • PR Task Order Process
  • Construction DDIRs for Projects > $1 million
  • Consultant DBE Goals
  • Environmental Process
  • Request for Reimbursement Q&A
  • CDOT Flood Recovery Website
  • Upcoming Trainings
  • Risk and Resiliency Process
slide-3
SLIDE 3

Task Order Process

slide-4
SLIDE 4

Task Orders – What are they?

  • Flood projects require task orders

– IGA covers multiple projects – Task orders are needed for individual projects – Exhibit C outlines budgets by phase and is included in the Task Order – Approvals required at

  • Flood Recovery Office
  • Flood Recovery Business Office
  • CDOT HQ (Chief Engineer and Controller)
slide-5
SLIDE 5

Task Order Flowchart

slide-6
SLIDE 6

Form 1243

  • Form 1243 defines

Local Agency and CDOT responsibilities

  • Determine project type

& scope

  • Budget needs
  • CDOT requirements
  • Go over LA checklist
slide-7
SLIDE 7

Creating a Construction DDIR for Projects > $1 mil

slide-8
SLIDE 8

Construction DDIR

  • Only applies to projects > $1 million
  • Pre-FIR meeting to discuss project – 20 percent

design

– Discuss design with Flood Recovery Office (FRO) – Evaluate construction cost estimate and prepare construction DDIR

  • If task order is in place, amend to reflect new

Construction DDIR costs

  • If task order not in place, reflect updated

numbers in task order

slide-9
SLIDE 9

Consultant DBE Goals and EEO Requirements

slide-10
SLIDE 10

EEO Project Requirements

  • Pre-Con/All Project requirements
  • DBE Goals/Requirements
  • OJT Goals/Requirements
  • Certified Payrolls/Davis Bacon
  • Project Finalization
  • Miscellaneous
slide-11
SLIDE 11

EEO Requirements Handout

slide-12
SLIDE 12

Environmental Process

slide-13
SLIDE 13

Environmental Process

  • Local agency responsibilities

– Clarify lead agency / coordination needs – Provide project description / map of work area – permanent and construction limits – Prepare documentation for environmental resources (resources on next slides) – Develop mitigation measures based on permits and FIR comments – Coordinating with resource agencies and obtaining permits

  • CDOT approves and signs Form 128

– “Top Half” and “Bottom Half”

slide-14
SLIDE 14

Environmental Process

slide-15
SLIDE 15

Environmental Resource Analysis

  • Air Quality and Noise

– CDOT will provide clearance or advise of additional analysis required

  • Hazardous Waste

– Initial / Modified Site Assessment or Phase I

  • Threatened or Endangered Species

– Conservation Measures from USFWS

  • Wetland Delineation (survey)
  • History and Historic Bridge

– Area of Potential Effects – direct and indirect – to be coordinated before surveys occur – Linear resources (ditches, railroads, etc.)

slide-16
SLIDE 16

Environmental Resource Analysis

  • Archaeology

– Area of Potential Effect generally = construction footprint

  • Section 4(f)

– Historic Properties, Trails, Parks – If Section 4(f) resources are present – consult with CDOT early!

  • Section 6(f)

– Recreation properties funded with Land and Water Conservation Funds – Uncommon for flood projects

  • Other
slide-17
SLIDE 17

Environmental Permits by Agency

  • Wetlands

– 404 Permit – Wetland Finding – 402 Certification

  • Senate Bill 40 approval
  • Floodplains Permit
  • Section 6(f) completion
  • Hazardous Waste Phase II Site Assessments
  • Stormwater Management Plan
slide-18
SLIDE 18

Environmental Permits by Contractor

  • Water Permits

– Construction Stormwater Permit – Construction Dewatering Permit

  • APCD bridge/structure demolition permit
  • Other demolition or local permits
slide-19
SLIDE 19

Request for Reimbursement Questions

slide-20
SLIDE 20

DOT Flood Recovery Website

http://www.coloradodot.info/projects/ floodrelatedprojects/local-agency-projects

– PowerPoint presentations – Forms – Manuals – What else?

slide-21
SLIDE 21

Local Agency Training is Coming – Stay Tuned

slide-22
SLIDE 22

Risk and Resiliency Process

slide-23
SLIDE 23

Risk and Resiliency Analysis

  • FHWA requires a risk-based analysis for

designing repairs to ensure they are cost effective and reduce the potential for future loss.

  • Currently FHWA has not adopted a risk

based model for analyzing resiliencies for infrastructure projects

  • CDOT & FHWA Piloting an infrastructure

model including peer reviews, sensitivity analysis and comparison to FEMA model

  • Model considers

– vulnerability of the asset – threat likelihood – probability of a successful failure.

“Resilience: Capability to anticipate, prepare for, respond to, and recover from significant multi-hazard threats with minimum damage to social well-being, the economy, and environment.”

slide-24
SLIDE 24

Economic Justification of Resilient Design Alternatives

  • Process based on RAMCAP approach published by the ASME for

Critical Infrastructure (American Society of Mechanical Engineers)

  • Assessing risk of assets to natural threats
  • Assessing vulnerability of assets to natural threats
  • Estimating consequences of future natural threats to Federal Aid

Roads

  • Reduced annualized risk for design alternatives are compared to

“Restore-in-Kind” designs to natural threats

slide-25
SLIDE 25

Economic Justification of Resilient Design Alternatives

  • Three pieces of information provided to CDOT/FHWA for

decision making regarding resilient design alternatives:

– Annualized monetary risk to design alternatives from natural threats – Measure of resilience for design alternatives from natural threats that reflects the anticipated number of vehicles that could be affected (not serviced) in any given year due to natural threats – Criticality Rating that reflects each asset’s impact on service provided by the owner

slide-26
SLIDE 26

Risk from Natural Threats

𝑆𝑗𝑡𝑙 = 𝐷 × 𝑊 × 𝑈 Where: R = annual monetary risk due to natural threats ($) C = consequences ($) V = vulnerability to identified consequences under a specific threat (probability) T = specific threat likelihood (probability)

slide-27
SLIDE 27

Resilience from Natural Threats

  • As per FHWA Emergency Relief Manual, cannot

account for user costs 𝑆𝑓𝑡𝑗𝑚𝑗𝑓𝑜𝑑𝑓 = 𝐵𝐵𝐸𝑈 × %𝐵𝐵𝐸𝑈 𝑂𝑝𝑢 𝑇𝑓𝑠𝑤𝑗𝑑𝑓𝑒 × 𝐸𝑏𝑧𝑡𝑃𝑣𝑢 𝑝𝑔 𝑇𝑓𝑠𝑤𝑗𝑑𝑓 × 𝑊 × 𝑈

slide-28
SLIDE 28

Damaged Site

Criticality Rating Provided for Context

  • Site Location and

Re-routing Alternative

slide-29
SLIDE 29

Criticality Rating Provided for Context

1 2 3 4 5 Very Low Impact Low Impact Moderate Impact High Impact Very High Impact Road Classification Rural Major Collector Urban Collector (Major or Minor) Minor Arterial Primary Arterial Interstate Freeway Expressway Need for Access by Essential Traffic Facility Open to Essential Traffic More Than 48 Hours After Event Multiple-Redundant Routes Available with No/Minimal Loss of Capacity Facility Open to Essential Traffic Within 48 Hours

  • f Event

Single Redundant Route Available with No/Minimal Loss of Capacity Facility Open to Essential Traffic Within 12 Hours

  • f Event

Multiple Redundant Routes Available with Some Loss of Capacity Facility Open to Essential Traffic Within 2 Hours

  • f Event

Single Redundant Route Available with Significant Loss of Capacity Facility Open to Essential Traffic Immediately Following Event Single Point of Failure Route Designation Truck % under 10% HAZMAT Route Truck %

  • ver 10%

Defense Route Evacuation Route Capital Cost of Damaged Site (per Lane Mile) < $5.0 million / lane mile $5.0 - $10 million / lane mile $10 - $20 million / lane mile $20 - $30 million / lane mile > $30 million / lane mile Score

Criticality Rating

slide-30
SLIDE 30

Resilience Index Score

Criticality Score Criticality Level Resilience Index Score 4 to 10 Low 1.0 11 to 15 Moderate 2.0 16 to 20 High 3.0

slide-31
SLIDE 31

Alternatives for Permanent Repairs

  • Three categories of roadway repairs:

– Restore facilities to pre-disaster conditions including upgrades to current best practices (RIK) – Repair facilities to current design standards (RTS) – Improve facilities to make more resistant to future events and/or betterments (Betterment)

slide-32
SLIDE 32

When is RnR Analysis needed?

  • If proposed improvements are to Standards or Betterments
  • RnR analysis completed for presentation to FHWA at

Preliminary Design review meeting (pre-FIR)

– RnR package submittal needed 4 weeks prior to FHWA meeting

  • Was the site damage rated “severe”?

– Yes

  • RnR will be required for improvements

above RTS

  • Betterments

– No

  • RnR will be required for improvements

above RIK

  • RTS and Betterments
slide-33
SLIDE 33

RnR Analysis Procedure

  • Complete RnR data sheet

– Site Information

  • General site information
  • Pre-Event conditions
  • Criticality/Resilience
  • Damage caused by event
slide-34
SLIDE 34

RnR Analysis Procedure

  • Complete RnR

datasheet

– Costs

  • Total Asset Value
  • ER costs
  • PR costs (RIK)
  • PR + Standards costs

(RTS)

  • Betterment costs

Notes Total Replacement Cost of Site if completely lost (Asset Value) PR (Replace in Kind + Best Practice) Description of Current Standard for site Current Standard Hydraulic Design Current Standard Hydraulic Capacity (ft3/sec) Current Standard Design Life Improve to Current Standards Cost above PR Cost Description of Betterment A for site Betterment A Hydraulic Design Standard Betterment A Hydraulic Design Capacity (ft3/sec) Betterment A Design Life Betterment A Cost above PR Cost Description of Betterment B for site Betterment B Hydraulic Design Standard Betterment B Hydraulic Design Capacity (ft3/sec) Betterment B Design Life Betterment B Cost above PR Cost Description of Betterment C for site Betterment C Hydraulic Design Standard Betterment C Hydraulic Design Capacity (ft3/sec) Betterment C Design Life Betterment C Cost above PR Cost

PLEASE ATTACH*

slide-35
SLIDE 35

RnR Analysis Procedure

  • Complete Project Costs

– Standardized estimate sheet – Engineers estimated construction cost – Use standardized percentages for

  • Design
  • Construction Oversight
  • Contingencies
  • Indirects

Project Location: Initials: Name of Road Date: Begin MP

  • r GPS Coordinates

End MP County Description of Work below : PROJECT MAJOR CONSTRUCTION ITEMS Length (ft) Width (ft) Depth (ft) Length (ft) Width (ft) Depth (in)

Total Replacement Project Cost Estimate

Major Earthwork Items Cost Unit Unit Cost Quantity Rock Fill CY $ 30.00 $0 Excavation & Embankment CY $ 12.00 $0 Seeding and Blankets (= to or steeper than 2:1 slope) AC $ 13,750.00 0.00 $0 Seeding and Straw (flatter than 2:1 slope) AC $ 3,700.00 0.00 $0

  • Str. Backfill (Class 1)

CY $ 30.00 $0

  • Str. Backfill (Flow -fill)

CY $ 95.00 $0 Channel Excavation CY $ 45.00 $0 Rip Rap to protect embankment slopes CY $ 95.00 $0 Remove & Recycle Asphalt SY $ 9.00 $0 Remove & Recycle Concrete SY $ 15.00 $0 Rock Scaling HR $ 100.00 $0 Remove & Recycle ABC (6") SY $ 10.00 $0 Recondition Subgrade (6") SY $ 2.00 $0 $ - $0 $ - $0 $ - $0 Estimated Cost Earthwork $0 Bases & Pavements Cost Unit Unit Cost Quantity 6" ABC Class 6 CY $ 30.00 $0 HMA (assume 5") area greater than 500LF TN $ 80.00 $0 PCCP (assume 9", but project specific overrides) SY $ 40.00 $0 HMA Patching - anything less than 500 LF TN $ 130.00 $0 $ - $0

slide-36
SLIDE 36

RnR Analysis Procedure

  • Miscellaneous

– Road User Cost Sheet – If available

  • Drawings of improvements
  • HEC-RAS
  • HEC-6 (streambank)
  • HY-8 (culvert)
slide-37
SLIDE 37

RnR Analysis

  • Questions

Andy Garton gartonad@pbworld.com (719) 452-4293 - office (719) 306-3460 - cell