SLIDE 1 Cardiac Rehab Utilization among Medicare Fee-for-service Beneficiaries, 2013
[preliminary findings]
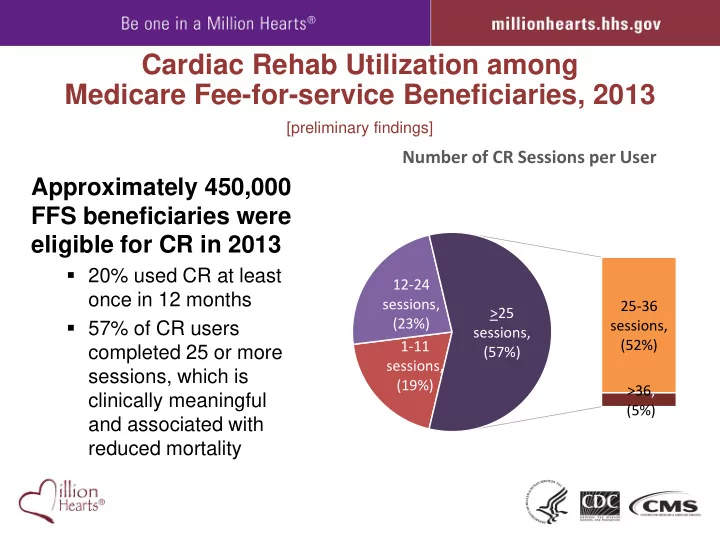
Approximately 450,000 FFS beneficiaries were eligible for CR in 2013
- 20% used CR at least
- nce in 12 months
- 57% of CR users
completed 25 or more sessions, which is clinically meaningful and associated with reduced mortality
1-11 sessions, (19%) 12-24 sessions, (23%) 25-36 sessions, (52%) >36, (5%) >25 sessions, (57%)
Number of CR Sessions per User
SLIDE 2
10 20 30 40 50 60 70 <65 65+ Male Female Non- Hispanic White Black Hispanic Asian Other Overall Age (years) Gender Race/Ethnicity Percentage
Eligible for CR and initiated Initiated CR and completed*
Cardiac Rehab Utilization Rates among Eligible Medicare Fee-for-service Beneficiaries by Age, Gender, Race/Ethnicity, 2013
[preliminary findings]
*Completed 25 or more CR sessions Source: Centers for Medicare and Medicaid Services’ Chronic Conditions Data Warehouse
SLIDE 3
20.2 12.6 21.3 23.5 15.9 22.0 10.5 10.0 13.1 18.7 10 20 30 40 50 60 70 <65 65+ Male Female Non- Hispanic White Black Hispanic Asian Other Overall Age (years) Gender Race/Ethnicity Percentage
Eligible for CR and initiated Initiated CR and completed*
*Completed 25 or more CR sessions Source: Centers for Medicare and Medicaid Services’ Chronic Conditions Data Warehouse
Cardiac Rehab Utilization Rates among Eligible Medicare Fee-for-service Beneficiaries by Age, Gender, Race/Ethnicity, 2013
[preliminary findings]
SLIDE 4
57.4 35.9 59.3 59.3 53.8 57.8 51.7 53.4 57.5 55.8 10 20 30 40 50 60 70 <65 65+ Male Female Non- Hispanic White Black Hispanic Asian Other Overall Age (years) Gender Race/Ethnicity Percentage
Eligible for CR and initiated Initiated CR and completed*
*Completed 25 or more CR sessions Source: Centers for Medicare and Medicaid Services’ Chronic Conditions Data Warehouse
Cardiac Rehab Utilization Rates among Eligible Medicare Fee-for-service Beneficiaries by Age, Gender, Race/Ethnicity, 2013
[preliminary findings]
SLIDE 5 # of HRRs
Among Medicare FFS beneficiaries aged ≥65 years in 2013 Source: Centers for Medicare and Medicaid Services’ Chronic Conditions Data Warehouse
CR Eligibility Rates per 1000 Beneficiaries
Widespread need throughout most of US, with the lowest CR eligibility rates in the Mountain and Pacific Divisions 14 15 15 15 13 16 15 11 11
SLIDE 6
23.3 16.7 24.9 33.7 18.9 15.3 14.2 24.5 17.0 57.2 61.1 54.1 48.9 63.4 57.8 60.8 52.2 59.8
10 20 30 40 50 60 70 New England Middle Atlantic East North Central West North Central South Atlantic East South Central West South Central Mountain Pacific Percentage Eligible for CR and initiated
Cardiac Rehab Utilization Rates among Eligible Medicare Fee-for-service Beneficiaries by Census Division, 2013
[preliminary findings]
*Completed 25 or more CR sessions Source: Centers for Medicare and Medicaid Services’ Chronic Conditions Data Warehouse
SLIDE 7 # of HRRs
Among Medicare FFS beneficiaries aged ≥65 years in 2013 Source: Centers for Medicare and Medicaid Services’ Chronic Conditions Data Warehouse
CR Eligibility Rates per 1000 Beneficiaries
400,000 beneficiaries were eligible in 2013 (overall rate of 13.8 per 1000 beneficiaries)
SLIDE 8 CR Billing Sites per 1000 CR Eligible Beneficiaries
Source: Centers for Medicare and Medicaid Services’ Chronic Conditions Data Warehouse
# of HRRs
2761 unique CR billing sites in 2013 (overall rate
- f 7.0 sites per 1000 CR eligible beneficiaries)
SLIDE 9 Greatest density of billing CR sites per eligible beneficiary in West North Central and Mountain Divisions
CR Billing Sites per 1000 CR Eligible Beneficiaries
Source: Centers for Medicare and Medicaid Services’ Chronic Conditions Data Warehouse
# of HRRs
6 5 8 17 5 6 6 10 5
SLIDE 10 [preliminary findings] Source: Centers for Medicare and Medicaid Services’ Chronic Conditions Data Warehouse
# of HRRs
Percentage who initiated CR
84,000 (21%) eligible beneficiaries initiated CR
SLIDE 11 [preliminary findings] Source: Centers for Medicare and Medicaid Services’ Chronic Conditions Data Warehouse
# of HRRs
Percentage who initiated CR
Among those eligible for CR, the greatest percentage initiated CR in the East and West North Central and Mountain Divisions 24 17 26 34 20 17 15 26 18
SLIDE 12 [preliminary findings] Source: Centers for Medicare and Medicaid Services’ Chronic Conditions Data Warehouse
CR Completion (≥25 Sessions) per 1000 CR Initiators
59% of CR initiators completed ≥25 sessions
SLIDE 13 [preliminary findings] Source: Centers for Medicare and Medicaid Services’ Chronic Conditions Data Warehouse
CR Completion (≥25 Sessions) per 1000 CR Initiators
Among CR initiators, the greatest percentage completing ≥25 sessions occurred in the South Atlantic, West South Central, and Middle Atlantic regions 58 63 56 51 66 61 63 54 61
SLIDE 14 Source: Centers for Medicare and Medicaid Services’ Chronic Conditions Data Warehouse
Eligibility Sites Billing for CR
East and West South Central
SLIDE 15 CR Initiation Completed ≥25 Sessions
West North Central
Source: Centers for Medicare and Medicaid Services’ Chronic Conditions Data Warehouse