
SLIDE 1
1
CANGAROO
Masaki Mori* for the CANGAROO team
* ICRR, The University of Tokyo
ICRR External Review, October 19-20, 2006, Kashiwa, Japan
2
CANGAROO Masaki Mori* for the CANGAROO team * ICRR, The University - - PDF document
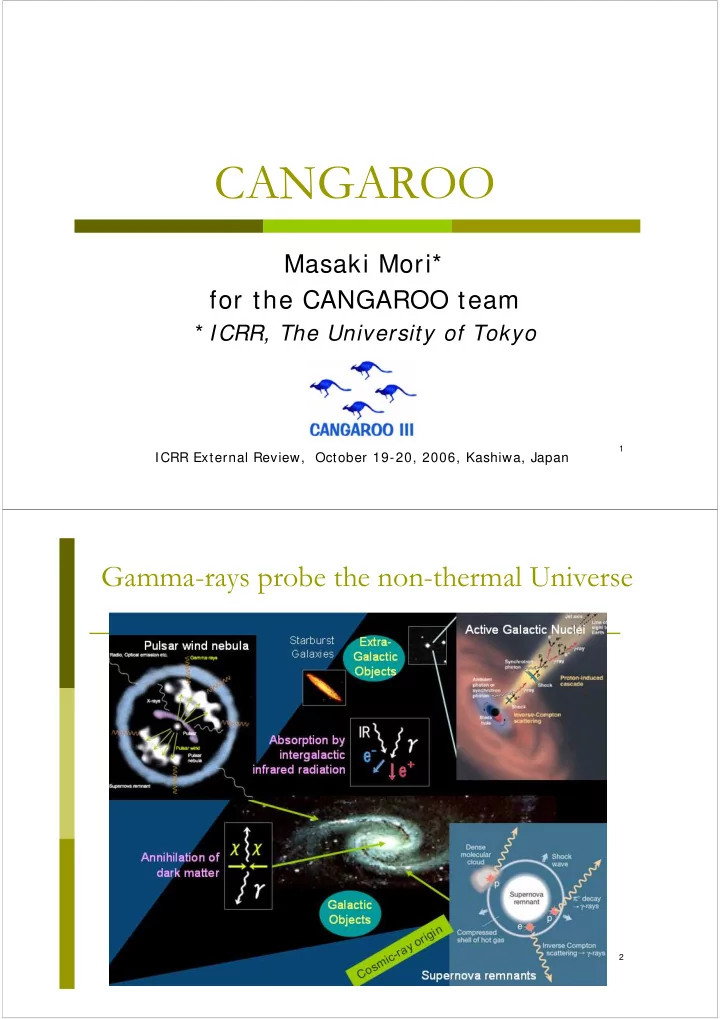
CANGAROO Masaki Mori* for the CANGAROO team * ICRR, The University of Tokyo 1 ICRR External Review, October 19-20, 2006, Kashiwa, Japan Gamma-rays probe the non-thermal Universe 2 We have to rely on ground-based observation at TeV energy
1
* ICRR, The University of Tokyo
ICRR External Review, October 19-20, 2006, Kashiwa, Japan
2
3
A ~ 104m 2 Ω ~ 10-2sr ~ 1 m 2 ~ π sr Diffuse photon spectrum
4
Woomera, South Australia
“CANGAROO” = Collaboration of Australia and Nippon for a GAmma Ray Observatory in the Outback
5
(Hatched: observable from Woomera)
We placed first priorities on Galactic objects, i.e. supernova remnants and pulsar wind nebulae, since the beginning of the CANGAROO project, as the first imaging Cherenkov telescope
6
University of Adelaide Australian National
University
Ibaraki University Ibaraki Prefectural
University
Konan University Kyoto University STE Lab, Nagoya
University
National Astronomical
Observatory of Japan
Kitasato University Shinshu University Australia Telescope
National Facility
Tokai University ICRR, University of
Tokyo
Yamagata University Yamanashi Gakuin
University
Hiroshima University
7
1987: SN1987A 1990: 3.8m telescope 1990: ICRR-Adelaide Physics
agreement
1992: Start obs. of 3.8m tel. 1999: 7m telescope 2000: Upgrade to 10m 2001: U.Tokyo-U.Adelaide
agreement
2002: Second and third 10m tel. 2004: Four telescope system
CANGAROO-I (3.8mφ) CANGAROO-II (10mφ)
8
Upgraded in 2000 from
7m telescope completed in 1999
114 x 80cm CFRP mirror
segments (first plastic-base mirror in the world!)
Focal length 8m Alt-azimuth mount 552ch imaging camera Charge and timing
electronics
(March 2000)
9
CANGAROO-II (Enomoto et al., Nature 416, 8232002) CANGAROO-I (Muraishi et al., A&A 354, L57, 2000)
10
Reimer & Pohl, A&A 390 (2002) L43 Butt et al., Nature 418 (2002) 489 0.8°
11
H.E.S.S.: Aharonian et al., A&A 449, 223 (2006)
⇒ Protons favored (?) RX J1713.7-3946
12
CANGAROO-II (Tsuchiya et al., ApJ 606, L115, 2004)
Whipple: Kosack et al., ApJ 608, L97 (2004) HESS: Aharonian et al., A&A 425, L13 (2004)
13
Horns, Phys.Lett. B607 (2005) 225 Aharonian et al., A&A 425, L13 (2004)
Dark matter annihilation signal??
14
(i) aligned disc to the orbital plane and interaction throughout the
(ii) mis-aligned disc and interaction in the ~ 200-day period around periastron (τ ), during which the radio emission is depolarized (iii) mis-aligned disc and interaction in two short periods, [ (τ -18 d) ~ (τ ~ -8d)] and [ (τ + 12 d) ~ (τ + 22 d)] CANGAROO-II: Kawachi et al., ApJ, 607(2004) 949
Obs.A Obs.B
2001 Mar 2000 Dec
15
H.E.S.S.: Aharonian et al., AA 437, L7 (2005)
CANGAROO-II: Katagiri et al., ApJ, 619, (2005) L163
16
CANGAROO-II: Katagiri et al., ApJ, 619, (2005) L163
IC π0
Spectral index 2.1 Crab-level flux
H.E.S.S.: Aharonian et al., AA 437, L7 (2005)
17
Signal Publish
Signal: detected, upper limit, v: variable
H.E.S.S.
→ Re-observations with CANGAROO-III stereo system
18
19
T2 T4 T3 T1
20
T2
Location:
31°06’S, 136°47’E 160m a.s.l.
Telescope:
114× 80cmφ FRP mirrors
(57m 2, Al surface)
8m focal length Alt-azimuth mount
Camera:
T1: 552ch (2.7° FOV) T2,T3,T4: 427ch (4° FOV)
Electronics:
TDC+ ADC
Enomoto et al., Proc. ICRC 2003
21
Kubo et al., Proc. ICRC 2003
22
: Construction : Observation start : Expansion to 10m : Observation : Tuning
T1 T2 T3 T4
2000 1999 2001 2002 2003 2004
3 3 1112 7 3 1 6
Stereo observation 2005
Global trigger system
12 8
Maintenance
2006
23
GEANT 3.21 base
80 layers for atmosphere (12.9g/ cm 2 each)
(< 10% change even if more layers were used)
Particle transport down to 20MeV Proprietary code to generate Cherenkov photons
Only photons coming to telescopes are tracked
Geomagnetic field of 0.520G (vert.) / 0.253G
(hor., 6.8°E of S)
Rayleigh scattering 2970g/ cm 2(λ/ 400nm) 4
(+ Mie scattering ~ 10% effect)
Detector parameters: reflectivity, point spread
function, light guide efficiency, PMT Q.E., etc.
Night sky background
24
Data compatible with “Desert model” of MODTRAN4
Rayleigh scattering
Desert model Rural model Urban model
Systematic errors under study
U B V
Take star images at various zenith angles with a cooled CCD camera
Energy Universe, Kashiwa, Feb. 2006
25
(θx, θy) θ2 distribution
(Simulation) θ2 [ deg2]
Target
0 0.25 0.5 Entries/ bin
Intersection point θ2 = θx
2+ θy 2
Angular resolution 0.25deg → 0.1 deg Energy resolution 30% → 15% Better S/N (no local muons)
26
Inconsistency with H.E.S.S results on some
sources ⇒ New observations with CANGAROO III Efforts for advanced analysis procedures
Measure more optical parameters
CCD measurements of spotsizes and stars
Use muons for calibration
Tune Monte Carlo simulation
Use the Crab as the standard candle
Flux obtained with Monte Carlo simulation is compared
with those reported by other groups
Independent teams within the collaboration are
working:
Results, especially detections, are double-checked
27
Showers from the Crab The oldest T1 has
higher energy threshold and bad efficiency for stereo observation
Only T2/ T3/ T4 are
used for stereo analysis
Stereo baseline
becomes short for the Crab
large zenith angles
28
Far core →small angle →bad accuracy Higher energy threshold ~ 1TeV Bad intersection accuracy
29
Blank : After IP fit Hatched : Before IP fit
⎥ ⎥ ⎦ ⎤ ⎢ ⎢ ⎣ ⎡ ⎟ ⎟ ⎠ ⎞ ⎜ ⎜ ⎝ ⎛ − + ⎟ ⎟ ⎠ ⎞ ⎜ ⎜ ⎝ ⎛ ≡
Telescopes 2 2 2
Armlength ) Armlength( ) Width(
ARM w
x,y x,y σ σ χ
Search intersection point (IP) by minimizing χ2 so that width along shower axis to be minimum and armlength to be near the expected value (< Armlength> = 0.75, Mesh size 0.025o)
Monte Carlo
30
using correlation matrix)
(appropriately normalized) combination F could be the “Fisher discriminant” for other sources.
for image parameters (xi).
i i ix
h
γ
2 2
) ( / D D D S − ≡
R.A. Fisher, Annals of Eugenics, 7 (1936) 179
F D γ h
31
Points: On-source Hatched: Off-source
Plot : observation Solid : MC gamma Dashed : background
IP fit + F > 0
203 excess events 5.8 sigma
R.Enomoto et al., ApJ 638, 397 (2006) Gamma- ray signal
Fisher discriminant
32
Excess event map
Angular resolution ~ 0.23 deg R.Enomoto et al., ApJ 638, 397 (2006)
S.Watanabe, Ph.D. thesis (2006)
HESS (2006)
Gamma-ray energy (TeV) Differential flux (cm -2s-1TeV-1)
CANGAROO Blue: FD Red: Likelihood
33
CANGAROO-I claims
Pulsar PSR1706-44 : 0.57Crab (~ 8σ, > 1 TeV)
[ Kifune et al. ApJ 431, L195, 1995]
[ Aharonian et al. A&A 432, L9, 2005]
SNR SN1006 : 0.81Crab (5.3σ, > 3 TeV) [ 1996]
0.62Crab (7.7σ, > 1.7TeV) [ 1997]
[ Tanimori et al. ApJ 497, L25, 1998]
[ Aharonian et al. A&A 437, 135, 2005]
Vela pulsar : 0.73Crab (5.8σ, > 2.5TeV) at 0.13°SE
[ Yoshikoshi et al. ApJ 487, L65, 1997]
[ Aharonian et al., A&A 448, L43, 2006] * Fluxes are given in unit of the Crab integral flux at 1TeV
34
T.Tanimori et al., ICRC2005
θ2 from pulsar
4 0 0 0 3 5 0 0 3 0 0 0 2 5 0 0 2 0 0 0 1 5 0 0 1 0 0 0 5 0 0
Entries/ bin
⇒ To be checked with our latest analysis methods
35
Gamma-ray energy (TeV) T.Tanimori et al., ICRC2005
X-ray image (ASCA) θ2 from NE rim ⇒ To be checked with our latest analysis methods
36
Pulsar position θ2 from Vela X center Vela X nebula
H.E.S.S., AA 448, L43 (2006)
R.Enomoto et al., ApJ 638, 397 (2006)
37
H.E.S.S.: Aharonian et al., AA 448, L43 (2006) ∝ E-1.45exp(-E/ 13.8TeV) R.Enomoto et al., ApJ 638, 397 (2006)
θ2< 0.6 deg2 Excess 561±114
38
CANGAROO-II claims
SNR RX J1713.7-3946: 0.51Crab, E-2.84±0.15 ±0.20 (11σ, > 0.5 TeV)
[ Enomoto et al., Nature 416, 823, 2002]
[ Aharonian et al. Nature 432, 75, 2004]
NGC253: 0.15Crab (11σ, > 0.5 TeV)
[ Ito et al., A&A 402, 443, 2003]
[ Aharonian et al. A&A 442, 177, 2005]
Galactic center: E-4.6(+ 1.2-5.0)
[ Tsuchiya et al., ApJ 606, L115, 2004]
[ Aharonian et al. A&A 425, L13, 2004]
SNR RX J0852.0-4622 : E-4.6(+ 1.7-4.4)
[ Katagiri et al., ApJ, 619, L163, 2005]
[ Aharonian et al. A&A 437, L7, 2005]
⇒ To be checked with CANGAROO-III stereo data
39
Excess event map
(NANTEN: Moriguchi et al. ApJ 2005)
(2005 Jan/ Feb)
θ2 from SNR center Fisher discriminant
40
Comparison with C-II
41
3-fold, 2004 Oct, 1179min (ON), 753min (OFF)
C.Itoh et al., A&A erratum, in press
HESS (extended) HESS (point) C-III (extended) C-III (point) 42
Treatment of “hot” channels
In the case of NGC253
Hot “box” scan for recovering flatness were carried out
(“box” is a unit of sixteen (four by four) neighbored PMTs)
further scan inside these sixteen channel were done and
finally find the field-deforming pixels.
Excess reduced to 700 (4σ) from 2000 (11σ) without above
procedures.
Different procedure for RX J1713.7-3946, Galactic
center, RX J0852.0-4622
Bright stars were in the field-of-view for these observations. RX J1713.7-3946: we removed hot pixels due to small
discharges triggered by the bright star passages.
Galactic center and RX J0852.0-4622: we selected them
based on the χ2 calculated by the pixel-hit rate and deviation of each ADC spectrum from the average one.
C.Itoh et al., A&A erratum, in press
43
K.Nishijima, talk at JPS meeting, Sep.2006
θ2 F V e r y p r e l i m i n a r y
44
Sum m ary table: update
45
MSH 15-52
Pulsar wind nebula (PSR 1509-58) H.E.S.S. : 25% Crab, extended (~ 6’x2’) Observation: 40hr in 2005, 90hr in 2006
HESS J1804-216
G8.7-0.1(SNR) / PSR J1803-2137 H.E.S.S. : 25% Crab, extended (~ 12’) Observation: 90hr in 2006
HESS J1303-631
Unidentified H.E.S.S. : 17% Crab, extended (~ 10’) Observation: 70hr in 2006
And more…
46
Intensive works…
Washing mirrors Mirror realignment Optical measurement Electronics tuning Muon data for calibration Etc.
~ 20% up!
Relative reflectivity U B V Reflectivity measurement using star images
Direct star images Reflected image of stars
After washing Before washing
Wavelength (nm)
(R. Kiuchi et al., in “Energy budget in the High Energy Universe”, Kashiwa, Feb. 2006)
T2
47
θ2 F
ON-OFF
Entries/ bin Entries/ bin
V e r y p r e l i m i n a r y V e r y p r e l i m i n a r y
By T.Nakamori
48
Independent analysis teams Target meetings, domestic workshops
Lead by Ibaraki, Yamanashi Gakuin
R&D works
Electronics: FADC, capacitor array [ Kyoto] Cloud monitor [ Tokai] Metal mirrors [ Tokai]
49
Upgrade of mirrors (FRP process limited spotsize.) Upgrade of T1 camera & electronics
Expected sensitivity after upgrade
Present Upgraded
θ2
Fisher discriminant
θ2 distribution γ / p separation
(Monte Carlo simulation assuming 1’-spotsize mirrors)
γ p
[ Requesting budget]
50
Cherenkov technique is now established. More sensitive next-generation projects are
awaited and should be fruitful!
Konopelko, Santa Fe WS, May 2006
Large-scale telescope
complex by international collaboration is inevitable.
R&D for large / wide-angle
arrays
CTA (Cherenkov Telescope
Array) [ mix of graded array?]
TenTen, HE-Astro, GRATIS…
51
Galactic center and SNR RX J0852.0-4622.
rays since 2004 March in stereoscopic mode.
Preliminary analyses appear to show no significant signals, yielding upper limits lower than the CANGAROO-I fluxes obtained several years ago.
the Vela X nebula.
follow the X-ray emission profile.
CANGAROO-II was not confirmed.
rapid time variation.
underway.