SLIDE 10 ** ¡DRAFT ¡– ¡DO ¡NOT ¡CITE ¡** ¡
¡
¡ ¡
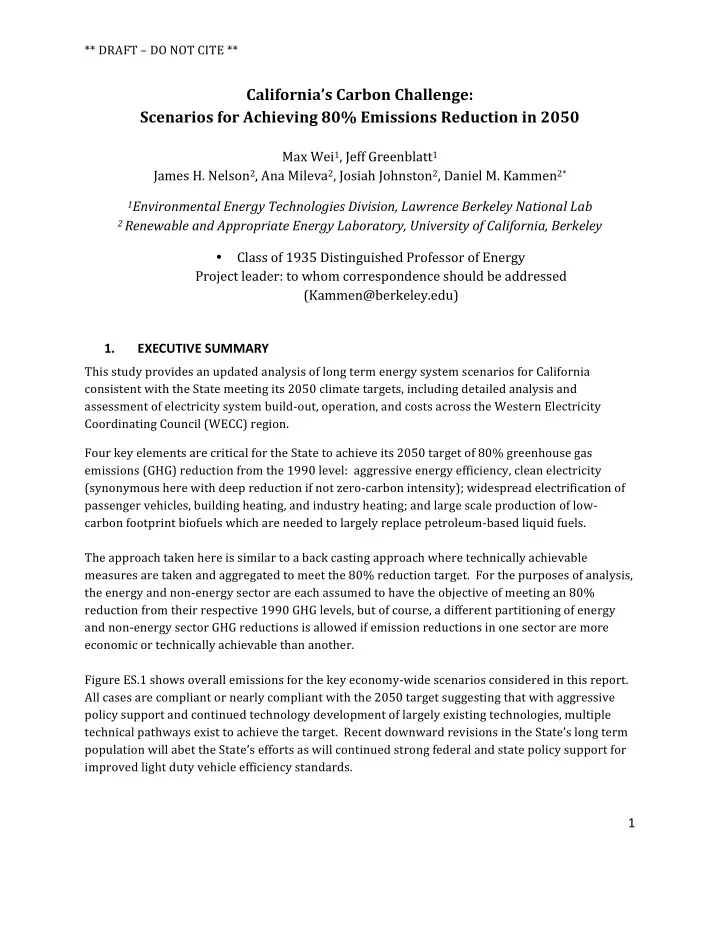
10 ¡ Figure 2-2: Base Scenario generation, storage, and transmission import/export capacity as a function of investment period in California and the rest of WECC.
¡ ¡ ¡
Figure 2-3: California average generation mix by fuel, average imports and exports by renewable average electricity demand in 2050 for all scenarios. A similar figure for the rest of WECC can be found in the main text.
0" 20" 40" 60" 80" 100" 120" 140" 160" 180" 2013" 2020" 2030" 2040" 2050"
California"Genera4on,"Storage,"" and"Transmission"Capacity"(GW)"
Transmission)Import/Export) Storage) Solar) Wind) Biopower) Biopower)CCS) Gas) Gas)CCS) Nuclear) Geothermal) Coal)CCS) Coal) Hydro) 0" 50" 100" 150" 200" 250" 300" 350" 400" 450" 500" 550" 600" 2013" 2020" 2030" 2040" 2050"
Rest"of"WECC"Genera6on,"Storage,"" and"Transmission"Capacity"(GW)"
Transmission)Import/Export) Storage) Solar) Wind) Biopower) Biopower)CCS) Gas) Gas)CCS) Nuclear) Geothermal) Coal)CCS) Coal) Hydro)
0" 10" 20" 30" 40" 50" 60" 70" 80"
0" 10" 20" 30" 40" 50" 60" 70" 80" Business"As"Usual" Base"Case" Reduced"Efficiency"Implementa@on" Aggressive"Electrifica@on" Small"Balancing"Areas" Limited"Hydro" Expensive"Transmission" Demand"Response" Sunshot"Solar" Low"Gas"Price" 12GW"Distributed"PV" California"50%"RPS" No"CCS" New"Nuclear" V20%"Carbon"Cap"/"BioCCS" V40%"Carbon"Cap"/"BioCCS"
2050 Average California Generation (GW)! Imports: Renewable! Imports: Non-Renewable! Exports: Renewable! Exports: Non-Renewable! Solar! Wind! Biopower! Biopower CCS! Gas! Gas CCS! Nuclear! Geothermal! Coal CCS! Coal! Hydro! Demand!