Calculation of Grain Boundary Pore Size Distribution in Light Water - - PDF document

calculation of grain boundary pore size distribution in
SMART_READER_LITE
LIVE PREVIEW

Calculation of Grain Boundary Pore Size Distribution in Light Water - - PDF document

Transactions of the Korean Nuclear Society Virtual Spring Meeting July 9-10, 2020 Calculation of Grain Boundary Pore Size Distribution in Light Water Reactor UO 2 Fuel by FRAPCON 4.0 Jae Joon Kim, Faris B. Sweidan, Ho Jin Ryu* Department of


slide-1
SLIDE 1

Calculation of Grain Boundary Pore Size Distribution in Light Water Reactor UO2 Fuel by FRAPCON 4.0

Jae Joon Kim, Faris B. Sweidan, Ho Jin Ryu* Department of Nucelar and Quantum Engineering, KAIST, Daejeon, 34141, Republic of Korea *E-mail hojinryu@kaist.ac.kr

  • 1. Introduction

The fuel fragmentation phenomenon is caused by

  • ver pressurization of grain boudnary bubbles formed

during normal operation under rapid heating conditions such as loss of coolant accident (LOCA) and reactivity initiated accident (RIA). The sudden temperature rise and the decrease in hydrostatic pressure due to cladding rupture or ballooning cause over pressurization of the bubbles in the grain boundary, which causes grain boundary cracking to pulverize the fuel. The pulverized fuel flows down between the fuel and the cladding gap, causing localized heating, which causes further severe deformation of the cladding and fuel emissions to the primary system, which greatly affects the safety of the

  • reactor. Many studies have been conducted to analyze

the cause of the fragmentation phenomenon. In typical Halden IFA reactor experiments, various burnup fuels were placed under LOCA simulation to analyze fragmentation and fragmented size of nuclear fuel [1]. Threshold pressure of lenticular bubbles causing fragmentation has also been suggested in various studies [2,3]. Based on the results of this research, studies to create a nuclear fuel fragmentation behavior model are also being actively conducted. Nuclear fission products contain various elements, and about 0.31 inert gas fission products are produced by one fission. The generated fission gas moves from the grain matrix to the grain boundary through diffusion, and the fission gases accumulated in the grain form of

  • bubbles. These bubbles grow little by little in the UO2

grain boundary, eventually connecting to each other along the grain boundary to form a long tunnel. The fission gas is released into the plenum, gap between fuel and cladding through this tunnel. It has been reported that when the fission gas is released by forming a tunnel, the pressure of the pores is decreased again, and the isolated bubble is formed again due to the sintering effect in high temperature of the normal operation condition [4]. In the outer rim part of the nuclear fuel, high probability of resonance capture of neutron in U- 238 leads to relatively active plutonium production, so the burnup is higher than the inside of the nuclear fuel. In addition, due to the low thermal conductivity of UO2, it has a significantly lower temperature than the fuel

  • centerline. The relatively high fission rate and low

temperature form a unique structure called a high burnup structure in the fuel rim part, which has a submicron grain size and a high porosity. Because the temperature gradient of the fuel is large and the burnup is different depending on the radial position, the size and number density of the fission gas bubble in grain boundary is different depending on the radial and axial position in the cladding of the fuel. In this study, the size and number density information

  • f these lenticular fission gas bubbles during normal
  • peration condition of light water reactor were derived

using FRAPCON 4.0 code. For simulation, the normal

  • peration condition of the Halden 650.4 reactor test was
  • used. The derived information can be used for

modelling of nuclear fuel fragmentation behavior of light water reactor.

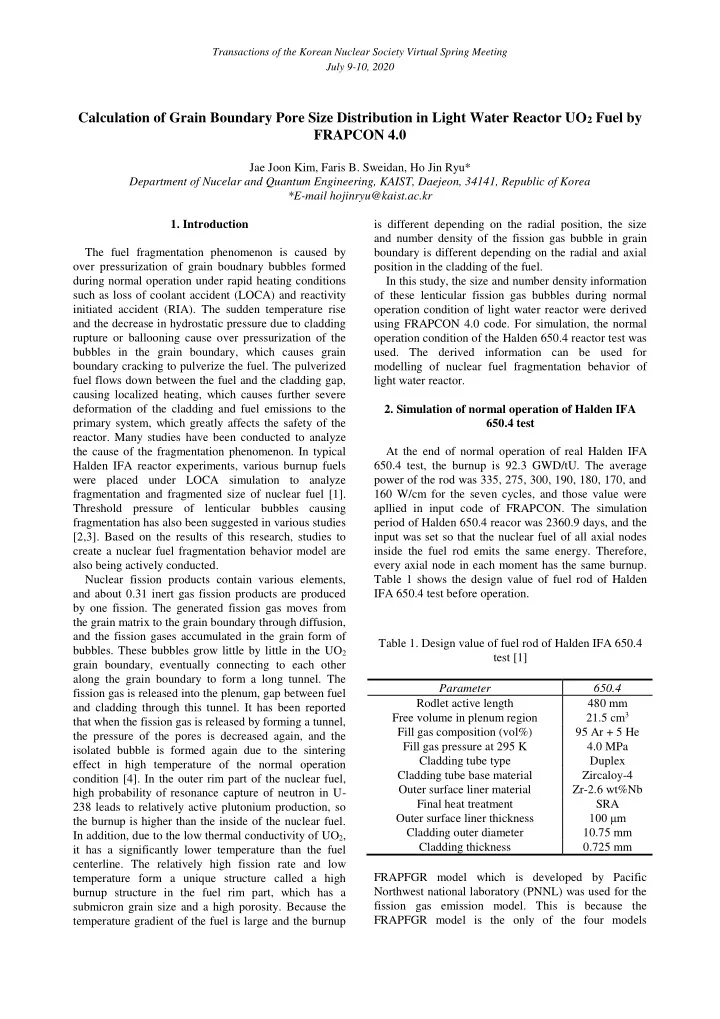
  • 2. Simulation of normal operation of Halden IFA

650.4 test At the end of normal operation of real Halden IFA 650.4 test, the burnup is 92.3 GWD/tU. The average power of the rod was 335, 275, 300, 190, 180, 170, and 160 W/cm for the seven cycles, and those value were apllied in input code of FRAPCON. The simulation period of Halden 650.4 reacor was 2360.9 days, and the input was set so that the nuclear fuel of all axial nodes inside the fuel rod emits the same energy. Therefore, every axial node in each moment has the same burnup. Table 1 shows the design value of fuel rod of Halden IFA 650.4 test before operation. Table 1. Design value of fuel rod of Halden IFA 650.4 test [1] Parameter 650.4 Rodlet active length 480 mm Free volume in plenum region 21.5 cm3 Fill gas composition (vol%) 95 Ar + 5 He Fill gas pressure at 295 K 4.0 MPa Cladding tube type Duplex Cladding tube base material Zircaloy-4 Outer surface liner material Zr-2.6 wt%Nb Final heat treatment SRA Outer surface liner thickness 100 μm Cladding outer diameter 10.75 mm Cladding thickness 0.725 mm FRAPFGR model which is developed by Pacific Northwest national laboratory (PNNL) was used for the fission gas emission model. This is because the FRAPFGR model is the only of the four models

Transactions of the Korean Nuclear Society Virtual Spring Meeting July 9-10, 2020

slide-2
SLIDE 2

available in FRAPCON 4.0 to calculate the fission gas emission by considering grain growth of UO2, high burnup structure formation at the rim part, and porosity increase of fuel. A total of 9 axial nodes were used, which means that the fuel rod was cut into 9 and calculated to have the same value for each node. For calculation of fission gas, there are 45 radial nodes, and fuel pellets are divided to have the same area of 45 part from center to edge.

  • 3. FRAPCON 4.0 simulation for Halden 640.4 test

The calculated average brunup at the end step is 91.85 GWD/tU in FRAPCON 4.0. Although the burnup values of all axial nodes are the same at each time step, since the coolant temperature is different for each axial node, the calculated fuel temperature is also different for each axial node. This indicates that the radial temperature distribution of the fuel is slightly different for each axial node, and the temperature in the fission gas emission model is also applied differently. The Fig. 1 below shows the burnup distribution of 5th axial node

  • f last time step of fuel of halden IFA 650.4 test which

has 91.85 GWD/tU average burnup. Because plutonium production occurs actively on the outside of the fuel, burnup is also higher on the outside of the fuel. Therefore, it was confirmed that the production of fission gas from the outer nuclear fuel is higher than that from center part. Fig 1. Radial burnup distribution of 5th axial node of last time step of fuel of halden IFA 650.4 test calculated by FRAPCON 4.0

  • 4. Methodology for calculating grain boundary

bubble size and results The fission gas bubble size was calculated by dividing it into a normal structure region and a high burnup structure region. 4.1 Calculation in normal structure region According to white et al [5], the radius of the grain boundary lenticular and the grain boundary area coverage fraction have the following relationship. (1) Assuming that the dihedral angle of UO2 is 50 degrees, the PV = nRT equation can be established using the above equation. (2) In this equation, n is amount of fission gas in grain boundary, T is temperature, and Ph is hydrostatic pressure which is corresponding to rod plenum pressure is this case in a given radial node, axial node and time

  • step. These value can be obtained from FRAPCON 4.0
  • calculation. The solution of this equation is grain

boundary lenticular bubble size in a given radial node, axial node, and time step, and the FRAPCON 4.0 code was modified to solve the equation using a numerical method. 4.2 Calculation in high burnup structure region As you can see in fig 1, because the burnup increases toward the outside of the fuel, and the outside temperature is lower than the center of the fuel, if the pellet average burnup exceeds about 60 GWD/tU, a unique microstructure called high burnup structure (HBS) is formed. This special microstructure has a porosity of 20% or more and a spherical bubble, not a lenticular shape. (3) The above equation is another empirical formula for pore density in HBS. [6] Similarly, if the ideal gas law is applied using this equation, the following equation can be obtained. (4) The solution of this equation is the pore size of the HBS region.

  • Fig. 2 shows the lenticular pore size distribution of the

5th axial node in the last time step of fuel of halden IFA 650.4 test derived using the above method. Each point

Transactions of the Korean Nuclear Society Virtual Spring Meeting July 9-10, 2020

slide-3
SLIDE 3

represents each radial node. The part drawn with the red line is the HBS area. Fig 2. Grain boundary fission gas bubble size distribution of 5th axial node of last time step of fuel of halden IFA 650.4 test calculated by FRAPCON 4.0

  • 5. Conclusion

In this study, the fission gas retention and release amount of nuclear fuel in the Halden IFA 650.4 test were calculated using FRAPCON 4.0. Using the calculated amount of fission gas in grain boundary data, the grain boundary bubble size distribution can also be

  • btained. If a fuel fragmentation model is developed

using the derived bubble size distribution along the radial direction of fuel, it can be determined whether or not fuel fragmentation occurs at each radial node in FRAPCON 4.0 during an LOCA accident and it can also be judged that how much volume fraction of nuclear fuel fragmentation occurs. ACKNOWLEDGMENTS This study is supported by the National Research Foundation (NRF-2018M2A8A1083889) REFERENCES [1]

  • K. Govers and M. Verwerft, “Simulation of

ballooning & relocation in the Halden LOCA tests with FRAPTRAN,” Proc. EHPG Meet., 2014. [2]

  • L. O. Jernkvist, “A review of analytical criteria

for fission gas induced fragmentation of oxide fuel in accident conditions,” Progress in Nuclear Energy., 2020. [3]

  • P. Chakraborty, M. R. Tonks, and G. Pastore,

“Modeling the influence of bubble pressure on grain boundary separation and fission gas release,” J. Nucl. Mater., 2014. [4]

  • R. J. White and M. O. Tucker, “A new fission-

gas release model,” J. Nucl. Mater., 1983. [5]

  • R. J. White, “The development of grain-face

porosity in irradiated oxide fuel,” J. Nucl. Mater., 2004. [6]

  • M. Lemes, A. Soba, and A. Denis, “An

empirical formulation to describe the evolution

  • f the high burnup structure,” J. Nucl. Mater.,

2015.

Transactions of the Korean Nuclear Society Virtual Spring Meeting July 9-10, 2020