
SLIDE 1
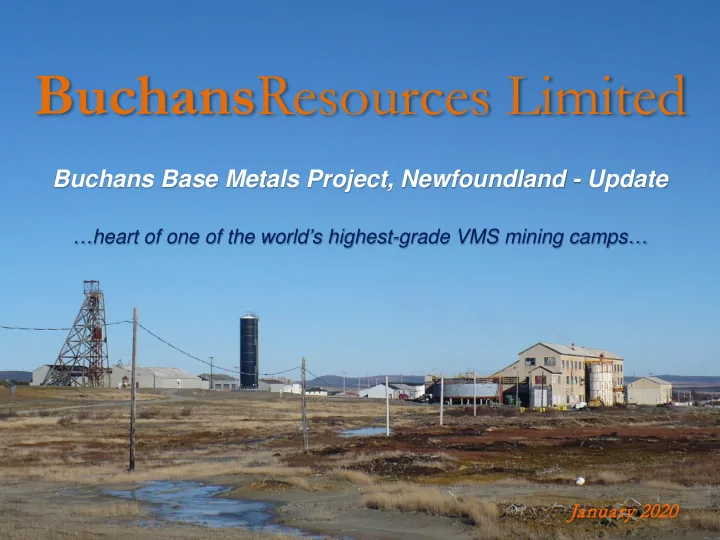
Buchans Base Metals Project, Newfoundland - Update
…heart of one of the world’s highest-grade VMS mining camps…
BuchansResources Limited
January 2 2020
Buchans Resources Limited Buchans Base Metals Project, Newfoundland - - PowerPoint PPT Presentation
Buchans Resources Limited Buchans Base Metals Project, Newfoundland - Update heart of one of the worlds highest-grade VMS mining camps January 2 2020 Buchans Resources Forward-Looking Statements Buchans Resources Limited
Buchans Base Metals Project, Newfoundland - Update
…heart of one of the world’s highest-grade VMS mining camps…
January 2 2020
Forward-Looking Statements
Buchans Resources Limited (“Buchans” or the “Company”) has prepared this presentation for information purposes only. The information contained herein was prepared by management on a best efforts basis and is believed to be accurate. This presentation contains or refers to "forward-looking information" within the meaning of applicable Canadian securities legislation. All statements in this release, other than statements of historical fact, which address activities, events or developments that the Company believes, expects or anticipates will or may occur in the future are forward-looking information. Wherever possible, words such as "plans", "expects" or "does not expect", "budget", "scheduled", "estimates", "forecasts", "anticipates" or "does not anticipate", "believes", "intends" and similar expressions or statements that certain actions, events or results "may", "could", " "would", "might" or "will" be taken, occur or be achieved, have been used to identify forward-looking information. In particular, all statements in this presentation that address estimated resource quantities, grades and contained metals, possible future mining, and exploration and development activities are forward looking statements. Forward-looking statements are subject to risks, uncertainties and other factors that could cause actual results to differ materially from expected results. Shareholders and prospective investors are cautioned not to place undue reliance on forward- looking information. By its nature, forward-looking information involves numerous assumptions, inherent risks and uncertainties, both general and specific, that contribute to the possibility that the predictions, forecasts, projections and various future events will not occur. The Company undertakes no obligation to update publicly or otherwise revise any forward-looking information whether as a result of new information, future events or other such factors which affect this information, except as required by law. This presentation may contain certain information derived from official government publications, industry sources and third
us or our advisers, and no representation is given as to its accuracy or completeness.
BuchansResources
2
Toronto
The Company
Canadian Junior Company focused in world- renowned base metal mining districts … demonstrated potential for exceptional mines
Orogenic Au
Buchans
(Zn-Pb-Cu-Ag-Au) Xtierra Ag-Zn-Pb (own 22% - TSXV:XAG)
Voisey’s Bay Style Ni-Cu-Co
Dec 31, 2019 - Reorganisation Completed 3 Separate Focused Companies
…”each of the Companies plans to take steps to apply for separate stock exchange listings”…
Buchans Resources
(TSXV or CSE)
BuchansResources
3
BuchansResources
4
Historical Production from Canada’s First Mineral District in Central New foundland
Duck Pond Mine Operator: Teck Resources 2007 to 2015 Production: 5.4 million tonnes averaging 5.8% Zn, 0.9% Pb, 3.3% Cu, 0.86 g/ t Au and59 g/ t Ag Buchans Mine Operator: ASARCO 1927 to 1984 Production: 16.2 million tonnes averaging 14.5% Zn, 7.6% Pb, 1.3% Cu, 1.37 g/ t Au, 126 g/ t Ag from five separate deposits (Lucky Strike ,Old Buchans, Oriental, Rothermere, and MacLeans)
Buchans
5
among world’s highest grade volcanogenic massive sulphide (VMS) camps
(historic production; 1928-84)
BuchansResources
Map Area
District Opportunity
Cambro-Ord. Volc. Millertown
20 km
Buchans
Buchans Resources NorZinc Properties NI 43-101 Resource Historic mine
Lundberg – 100% BRL
Indicated – 16.79 Mt @ 1.53% Zn, 0.64% Pb, 0.42% Cu, 5.69 g/t Ag, 0.07 g/t Au Inferred – 0.38 Mt @ 2.03% Zn, 1.01% Pb, 0.36% Cu, 22.35 g/t Ag & 0.31 g/t Au ($20US NSR cut-off)
Bobbys Pond (1.1% CuEq) - 100% BRL
Indicated - 1.1 Mt @ 4.6% Zn, 0.4% Pb, 0.9% Cu, 16.6 g/t Ag, 0.2 g/t Au Inferred- 1.2 Mt @ 3.8% Zn, 0.3% Pb, 1.0% Cu, 11.0 g/t Ag & 0.06 g/t Au
Lemarchant 100% NZC (4% ZnEq. cut-off)
Indicated - 2.42 Mt @ 6.2% Zn, 1.6% Pb, 0.7% Cu, 64.0 g/t Ag, 1.22 g/t Au Inferred – 0.56 Mt @ 4.7% Zn, 1.1% Pb, 0.5% Cu, 44.7 g/t Ag, 1.1 g/t Au
Daniels – 100% BRL
Indicated-0.93 Mt @ 5.1% Zn, 2.5% Pb, 0.3% Cu, 101.4 g/t Ag, 0.6 g/t Au Inferred- 0.33 Mt @ 4.6% Zn, 2.1% Pb, 0.3% Cu, 85.9 g/t Ag, 0.53 g/t Au (2% Zn cut-off)
Long Lake 100% NZC (using a 7.0% zinc equiv. cut-off)
Indicated – 0.41 Mt @ 7.8% Zn, 1.6% Pb, 1.0% Cu, 49 g/t Ag, 0.57 g/t Au Inferred – 0.08 Mt @ 5.8% Zn, 1.2% Pb, 0.7% Cu, 34 g/t Ag, 0.48 g/t Au
Duck Pond Mine (past prod.)
5.0Mt @ 4.4%Zn, 2.7%Cu, 53g/t Ag, 0.6 g/t Au (Teck, 2007-15)
Buchans (past prod.) 16.2 Mt
14.5% Zn, 7.6% Pb, 1.3% Cu, 1.37 g/t Au & 126 g/t Ag (Asarco, 1928-1984) Tulks Hill – 100% BRL
Indicated-0.43 Mt @ 4.0% Zn, 1.6% Pb, 0.9% Cu, 35.1 g/t Ag, 1.2 g/t Au (1.1% CuEq)
Boomerang Deposits 100% NZC (1% Zn cut-off)
Indicated - 1.36 Mt @ 7.1% Zn, 3.0% Pb, 0.5% Cu, 110.4 g/t Ag, 1.7 g/t Au Inferred - 0.28 Mt @ 6.7% Zn, 2.9% Pb, 0.4% Cu, 96.5 g/t Ag, 1.3 g/t Au Domino (Inferred) – 0.41 Mt @ 6.3% Zn, 2.8% Pb, 0.4% Cu, 94 g/t Ag, 0.6 g/t Au Hurricane (Inferred) – 0.06 Mt @ 13.4% Zn, 7.0% Pb, 1.2% Cu, 159 g/t Ag, 0.9 g/t Au
BuchansResources
6
200 400 600 800 1,000 1,200 1,400 1,600 1,800
Zn (lbs) Pb (lbs) Cu (lbs) 583 245 158 1,179 357 136 1,762 602 294 Millions
Zn, >600 million lbs Pb, & ~300 million lbs Cu
Zn, 245 million lbs Pb & >158 million lbs Cu
study demonstrated ore from 5
could be processed using a sequential flow sheet in a central milling facility
* combined Indicated & Inferred resources Deposits: Lundberg, Bobbys, Daniels, Tulks Hill, Boomerang, Lemarchant, Long Lake
Buchans District
(undeveloped resources)
Inferred mineral resources are considered too speculative geologically to have the economic considerations applied to them that would enable them to be considered for estimation of mineral reserves, and there is no certainty that inferred mineral resources will be realized.
District Total VLSG (all NI 43-101) Lundberg (largest & most advanced)
BuchansResources
7
Red Indian Lake
deposits (incl. past producers-projected to surface) sulphide prospects favourable alteration 5 km
Lundberg (near surface - stockwork)
below Lucky Strike (massive sulphides)
Outline of Buchans Camp rocks after GSC 2016
Buchans camp rocks
Asarco mined 16.2 Mt 14.5% Zn, 7.6% Pb, 1.3% Cu, 1.37 g/t Au & 126 g/t Ag (1928-1984)
BUCHANS Lundberg Deposit
BuchansResources
8
Schematic block diagram of the MacLean channel, Lucky Strike area, illustrating hydrothermal vents along synvolcanic faults, diatreme activity associated with subvolcanic plutonic body, ore bearing slumps and debris flows (modified after Kirkham and Thurlow, 1987; and Thurlow, 2001).
stockwork ore
sulphide-rich vein networks (2-6% Zn-Pb-Cu) (not mined)
transported ore
debris flow deposits (16-22% Zn-Pb-Cu) (52% of ore mined)
VMS DEPOSITS (Buchans model)
in situ ore
massive sulphides (25-28% Zn-Pb-Cu) (48% of ore mined)
Lundberg Lucky Strike
In a VMS setting ….
BuchansResources
9
BuchansResources
1 0
Lundberg Project
VMS Stockw ork Deposit Surrounding Lucky Strike Deposit, Buchans Mine
Lucky Strike (massive sulphides): Production 1928-1958 and 1972-1979 High grade deposit of 5.6 M tonnes averaging 18.4% Zn, 8.6% Pb, 1.6% Cu, 112 g/t Ag & 1.7 g/t Au
Mineralization
LUNDBERG Bulk Tonnage Resource BuchansResources
11
Lundberg H-3356 – 37 m
LUNDBERG
STOCKWORK DEPOSIT
2008 – 1st resource estimate (100% Inferred)
2013 – 2nd resource estimate (84.5 % indicated)
2018 - drilled 17 holes (2,205 m) upgrade resource
BuchansResources
12
Mineralization
LUNDBERG RESOURCE
Quoted resources are pit-optimized. Resources that are not mineral reserves do not have demonstrated economic viability. Resource tonnages have been rounded to the nearest 10,000. Metal price assumptions: US $1.20/lb Zn, $1.00/lb Pb, $3.00/lb Cu, $1,250/oz Au, and $17/oz Ag. Additional disclosure and details available in Buchans Resources Limited news release dated March 1, 2019.
BuchansResources
In-Pit Lundberg Deposit Mineral Resource Estimate (Effective February 28, 2019)
NSR Cut-off (USD/t) Category Tonnes Zn % Pb % Cu % Ag g/t Au g/t Zn Eq. % NSR (USD/t) Strip Ratio 20 Indicated 16,790,000 1.53 0.64 0.42 5.69 0.07 3.38 54.98 2.9 Inferred 380,000 2.03 1.01 0.36 22.35 0.31 4.46 72.95
Indicated Category hosts >1.25 billion pounds of ZnEq contained metal as 566 Mlbs Zn, 237 Mlbs Pb, 156 Mlbs Cu, 3 MOz Ag & <38,000 Oz Au
Inferred Indicated mineral deposit not within optimized pit shell (not included in 2019 pit-optimized MRE)
Resource Category 2019 Lundberg MRE (plan view)
See Buchans Resources Limited press release dated March 1, 2019 for further explanation.
200 m
N
Optimized Pit Shell
(surface limits)
Lundberg deposit
(limits projected to surface)
BuchansResources
Lundberg 2019 Mineral Resource Estimate
(optimized pit-constrained)
14
Kidd Creek Brunswick No.12 Flin Flon Horne Neves Corvo Cu (Portugal) LaRonde Bawdwin (Burma) 777/ Callinan Cayeli (Turkey) Roseberry (Australia)
Buchans
Hellyer (Australia) 100 200 300 400 500 600 700 800 900 1,000 20 40 60 80 100 120 140 160
BuchansResources
Cu = $2.78/lb Zn = $1.18/lb Pb = $0.92/lb Ag = $15.57/oz Au = $1312/oz
Feb 15, 2019 (Kitco)
Tonnes (million) Gross Metal Value $US/tonne
* unverified data from multiple sources including historic production & pre-production resource estimates
Metal Prices: $US
1 km N
Lucky Strike
BRL BRL BRL BRL Oriental
Lundberg
(low-grade stockwork near-surface )
Sandfill Clementine Oriental East West Orebodies Lucky Strike North Middle Branch Old Buchans North
Orebodies (historic/ mined out) (mined 1928-1984 - 16.2 M tonnes 14.5% Zn, 7.6% Pb, 1.3% Cu, 1.37 g/t Au & 126 g/t Ag Stringer Mineralization (projected to surface) Historic Prospect (undeveloped, projected to surface) Lundberg & Engine House Zone (resource projected to surface)
Target Areas H-18-3513 - 7.0 m of 7.4% CBM
0.69% Cu, 1.58% Pb, 5.15% Zn, 33.5 g/t Ag & 0.21 g/t Au
2.96% Cu, 5.13% Pb, 15.5% Zn, 96.4 g/t Ag & 0.27 g/t Au
and 3.10 m 6.4% CBM
0.22% Cu, 1.99% Pb, 4.19% Zn, 52.04 g/t Ag & 0.25 g/t Au
0.56% Cu, 5.50% Pb 11.40 % Zn, 152.8 g/t Ag & 0.70 g/t Au
H-18-3524 - 1.8 m of 9.48% CBM
0.76% Cu, 3.15% Pb, 5.57% Zn, 90.5 g/t Ag & 0.37 g/t Au
1.26% Cu, 4.87% Pb, 8.70% Zn, 133.2 g/t Ag & 0.47 g/t Au
Buchans – Exploration Drilling BuchansResources
Relogged (2014-17)* >123,000 m of core (652 holes)
16
1 km
N
BRL BRL BRL BRL
Oriental In Situ Orebody – mined out Transported Orebody – mined out Stringer Mineralization (projected to surface; ASARCO) Prospect (undeveloped, projected to surface) Lundberg Deposit - 2019 Resource (projected to surface)
Clementine Sandfill West Orebodies Lucky Strike North Middle Branch Middle Branch (hist. intercept) 1.8 m - 0.4% Cu, 3.1% Pb, 4.8% Zn, 48 g/t Ag & 0.7 g/t Au
Lundberg Deposit
Old Buchans North
17
Old Buchans North - hist. intercepts up to 2.74 m 2.6% Cu, 9.0% Pb, 23.7% Zn, 147.4 g/t Ag, & 3.4 g/t Au
Lundberg Optimized Pit (2019 Resource
Sandfill
Exploration Target Area (2019 Resource
Advanced Target
Lucky Strike
Buchans
Exploration
Relogged (2014-19)* >128,000 m of core (670 holes)
Clementine (historic, non-43-101 compliant) 360,000 tonnes 0.3% Cu, 2.6% Pb, 4.9% Zn & 41.0 g/t Ag Sandfill (historic, non-43-101 compliant) 68,000 tonnes – 1.5% Cu, 4.7% Pb, 10.0% Zn, 85.7 g/t Ag & 0.34 g/t Au
Regional Target
BuchansResources
Y Y Y
Y Y
Y
Footwall stockwork mineralization
? ? ? ? ? ? ? ?
Mineralization at Buchans Horizon Buchans Horizon absent (cut off) Too shallow – did not reach Buchans Horiz. Buchans Hor. no sig. mineralization
H-18-3513 - Sandfill
7.0 m - 7.4%CBM - 0.69% Cu, 1.58% Pb, 5.15% Zn, 33.5 g/t Ag, & 0.21 g/t Au
3.1 m - 6.4%CBM - 0.22% Cu, 1.99% Pb, 4.19% Zn, 52.04 g/t Ag & 0.25 g/t Au
Sandy Lake (prom. qtz rhyolite/ arkose/basalt) Diabase Buchans River (rhyolite/ m.sulphs./ felsic tuffs
H-18-3522 - 0.30 m - 0.23% CBM
0.07% Pb, 0.16% Zn, 162.8 g/t Ag & 0.054 g/t Au
Historic drill hole/ BMC drill hole
250 m 1.8 m – 8.3% CBM @ 553 m 0.4% Cu, 3.1% Pb, 4.8% Zn, 48 g/t Ag & 0.7 g/t Au
Sandfill-Middle Branch Trend
Woodman’s Brook (structural cover) Woodman’s Brook (structural cover)
~10 Mt @ 25% CBM
0.24 m mass. pyrite-barite 0.1% CBM + 189 g/t Ag @ 438 m
B
3.1 m - 2.4% CBM 0.1% Cu, 0.7% Pb, 1.6% Zn, 7 g/t Ag 1.52 m - 4.9% CBM 0.3% Cu, 2.0% Pb, 2.6% Zn, 93 g/t Ag, 1.03 g/t Au 1.22 m - 17.7% CBM 0.2% Cu, 3.9% Pb, 13.7% Zn, 62 g/t Ag, 1.20 g/t Au 3.35 m - 21.7% CBM 2.6% Cu, 6.5% Pb, 12.6% Zn, 87 g/t Ag, 0.34 g/t Au 3.66 m - 11.2% CBM 0.5% Cu, 3.1% Pb, 7.7% Zn 0.46 m - 31.3% CBM 1.4% Cu, 8.6% Pb, 21.3% Zn, 219 g/t Ag, 2.74 g/t Au 0.24 m - 13.4% CBM (one sample) 1.6% Cu, 1.8% Pb, 10.0% Zn, 26 g/t Ag, 0.4 g/t Au
BuchansResources
18
BuchansResources
1 9
Bobbys Pond and Daniels Pond Deposits
Daniels Pond Deposit
as the Boomerang deposit
Resource Estim ate for Bobbys Pond 1 Bobbys Pond Deposit
mineralization which comes to surface
system continues at depth
Zn
Category Tonnes Grade Zn (%) Pb (%) Cu (%) Ag (g/t) Au (g/t) Indicated 1,162,00 4.44 2.12 0.31 87.79 0.60 Inferred 445,000 3.88 1.74 0.27 81.63 0.52
Resource Estim ate for Daniels Pond 1
Category Tonnes Grade Zn (%) Pb (%) Cu (%) Ag (g/t) Au (g/t) Indicated 1,095,00 4.61 0.44 0.86 16.6 0.2 Inferred 1,177,00 3.75 0.27 0.95 10.95 0.06
BuchansResources
2 0
Metallurgical Research Program 2 0 1 6
mine sites by Dense Media Separation (DMS).
the production of a marketable Cu, Pb and Zn concentrate products from the various deposits.
concept and provides direction for future project planning.
Research Program Funded by Research Developm ent Corporation ( RDC)
Lemarchant
five deposits
concentrates compared with bulk flotation flowsheet.
Cu concentrates at m arketable grades
Results of Research Program March 2 0 1 7 :
BuchansResources
2 1
Reasons to I nvest in Buchans Resources
Advanced Zn-Cu-Pb-Au-Ag projects in Newfoundland Stable, mining-friendly with excellent access to infrastructure and low exploration costs Newfoundland ranked 14th globally for investment attractiveness by the Fraser Institute in 2016 Existing high grade deposits remain open for expansion Numerous high priority VMS prospects outside of the current deposits Many acquisition opportunities in the region Management team with operating and exploration experience in Newfoundland Exploration stage Zn-Cu-Pb-Au-Ag projects in Newfoundland Proven track record of advancing/ developing/ selling projects through feasibility, permitting and construction
Summary
Lucky Strike
www.BuchansResources.com
Buchans Project
Exploration
Looking Forward
BuchansResources
22
BuchansResources
2 3
Buchans Resources Lim ited
BuchansResources