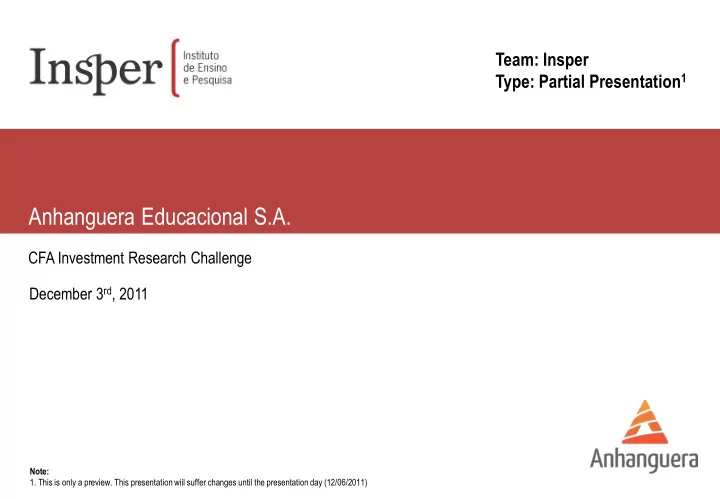
anhanguera educacional s a
play

Anhanguera Educacional S.A. CFA Investment Research Challenge - PowerPoint PPT Presentation

Team: Insper Type: Partial Presentation 1 Anhanguera Educacional S.A. CFA Investment Research Challenge December 3 rd , 2011 Note: 1. This is only a preview. This presentation wiil suffer changes until the presentation day (12/06/2011)


  1. Team: Insper Type: Partial Presentation 1 Anhanguera Educacional S.A. CFA Investment Research Challenge December 3 rd , 2011 Note: 1. This is only a preview. This presentation wiil suffer changes until the presentation day (12/06/2011)

  2. Introduction Anhanguera’s stock history 1 and target price 45 40 BUY Rating 35 Target Price: R$ 31 30 25 Upside 72% 20 18.05 15 Dec-10 Jan-11 Feb-11 Mar-11 Apr-11 May-11 Jun-11 Jul-11 Aug-11 Sep-11 Oct-11 Nov-11 Source : Bloomberg / INSPER student’s estimates Based on a DCF model, we rate Anhanguera with a buy recommendation Note: 1. Data until 12/02/2011

  3. Contents SECTION 1 Education Sector’s Drivers 4 SECTION 2 Anhanguera’s Business’ Drivers 7 SECTION 3 Financial Analysis 12 SECTION 4 Valuation 16 SECTION 5 Risks 20 Disclaimers 24

  4. SECTION 1 Education Sector’s Drivers

  5. 1. Education Sector’s Drivers 1.1 Penetration Rate on Post Secondary Education Brazilian education sector offers a huge growth opportunity Post Secondary Penetration Rate (%) 1 Penetration of Post Secondary Education in Brazil (%) 1 82% 77% 75% There’s a large Underpenetration educational gap in 67% mainly due to Brazil to be middle and low 59% fulfilled... class 52% Avg. 51% 35% 27% ...and we believe 23% 20% FIES and Brazil’s GDP growth are 9% crucial factors to 3% diminish it 1 2 3 4 5 6 7 8 A B C D/E Source: SEMESP Source: Hoper Consultoria Education in Brazil is a promissing sector, with large future growth possibilities Note: 1. Data from 2008

  6. 1. Education Sector’s Drivers 1.2 GDP Growth and FIES The two main drivers to develop the educational sector Sectors Elasticities Brazil’s GDP Growth Education 1.6x Having a high 4.2% elasticity, the Transportation 1.3x Brazilian Healthcare 1.3x 3.8% 3.7% educational sector Culture &… 1.1x Entertaiment will benefit from the Personal Expenses 1.1x robust future Housing 1x economic growth... Food 0.7x 07 - 10 11 - 15e 16 - 20e Source: SEMESP Source: Bacen / LCA Consultores FIES Effects FIES Eligibility Course materials aproved by regulators 1 ...while FIES will Enrollments growth Quality test scores also help to boost above 60% enrollments, 2 Dropouts decrease reducing dropouts Family income below 2 minimum wages and delinquency 3 Delinquency minimized Pay a fraction of the course while enrolled Source: Company’s Data For those reasons, education sector shows great potential for growth

  7. SECTION 2 Anhanguera’s Business’ Drivers

  8. 2. Anhanguera Business Drivers 2.1 Anhanguera’s Business Drivers Overview Anhanguera’s three competitive advantage pillars 2007 – 2010 Comparative Enrollment (‘000) Anhanguera’s Competitive Advantages CAGR CAGR CAGR 1 Price and Quality 130% 73% 12% Anhanguera is able 358  Lower comparative tuition price to deliver a higher enrollment growth  Greater comparative quality compared to its peers... 248 Distance Learning Centers 2  Broader target audience 175  Greater economies of scale ...mainly due to three competitive advantages: lower 3 Acquisition and Integration Teams 94 price and high 57  Great acquisition track record quality, DLC’s participation and  5 - year margin integration with AEDU’s standards 18 acquisitions 07 ’ 10 ’ 07 ’ 10 ’ 07 ’ 10 ’ 1 2 3 Source : Companies ’ Data Anhanguera stands out among its peers, making it the sector’s top choice

  9. 2. Anhanguera Business Drivers 2.2 Price and Quality Anhanguera has the best quality and the greatest affordability compared to its peers Average Tuition Price (BRL) National Student Performance (ENADE) 536 2.86 Despite having the 386 lowest tuition, 288 Anhanguera offers a 2.69 2.67 better service when compared to its peers... 1 2 3 1 2 3 Source : Companies ’ Data Source : Companies ’ Data Comparative Quality and Price Price and Quality ENADE scores  Economies of scale 2.9 2.90 ...This results in the Greater Performance  Partnerships with quality suppliers 2.85 competitive 2.85 advantage of having 2.8 2.80  Standardized course structure the best quality to Lowe Price 2.75 2.75 cost ratio 2.7 2.70  Teachers’ salary based on ENADE results 2.65 2.65 0 150 300 450 600 Tuition Anhanguera is able to offer the best of both worlds to its customers

  10. 2. Anhanguera Business Drivers 2.3 Distance Learning Centers Great convenience delivering high margins Percentage of Total Students on DLCs Target Audience 42% 48+ 42-48 Distance Learning 36-42 Distance Centers have a 16% 30-36 Learning wider target Campus 24-30 Center 4% audience because 18-24 of its greater 12-18 convenience... 1 2 3 12 and under Comparative 2010 Gross Margin Distance Learning Centers Characteristics 55%  Wider target audience ...And have a higher gross margin (55%),  Higher margins due to its great cost 41% dillution  Located in cities with less than 100,000 inhabitants  Hybrid program (students attend centers once a week) 2010 Campus 2010 Distance Learning Source : Companies ’ Data Distance Learning Center is one of Anhanguera’s engine

  11. 2.4 Acquisitions M&A Team deliver great execution with fast integration of acquired units Number of Students Acquired (‘000) Anhanguera’s Expected Acquisition Targets 1 227 Acquisitions track record explicits the efficiency of the 66 57 execution team... 1 2 3 Source : Companies ’ Data Acquisition EBITDA Margin Evolution 30% 27% ... And the margins 23% evolution shows an 17% able integration team 10% 0 Year 0 Year 1 Year 2 Year 3 Year 4 Year 5 Source : Insper Student’s Estimates Source : Insper Student’s Estimates Acquisition and Integration teams are valuable assets to the company Note: 1. Ilustrative view. Targets not precisely positioned.

  12. SECTION 3 Financial Analysis

  13. 3. Financial Analysis 3.1 Revenue Model Anhanguera’s 4 enrollment growth channels Net Revenue (BRL Million) Anhanguera’s Enrollment and Capacity Channels CAGR 4% 1 Acquisitions Revenue growth  Great acquisition track record sustained by 4,236 enrollment increase... CAGR 3,468 2 Greenfields 17% • Projection of 7 new campuses in the next years CAGR 69% Campus’ Organic Growth 3 ...Since we forecast 1,558  FIES and GDP growth support this channel Anhanguera’s tuition using just the inflation rate Distance Learning Centers’ Organic Growth 4 112  Broader target audience 2006 2011E 2016E 2021E Source: Company’s Data Those 4 channels deliver our expected revenue rise

  14. 3. Financial Analysis 3.2 Enrollment Growth Channels 4 channels sustaning a high growth on Ananguera’s student base Acquisitions (‘000) Number of Campuses CAGR CAGR 1% 235.5 1% CAGR Anhanguera’s 180 65 60 27% 58 historycal growth has been 22 outstanding... 0 06' - 10' 11' - 15' 16' -22' 07' 11' 16' 22' Campuses’ Enrollments (‘000) Distance Learning Centers ’ Enrollments (‘000) CAGR CAGR 2% 3% CAGR CAGR ... and we expect a a 528 14% 500 280 17% 250 smaller, but still CAGR CAGR worthy growth to 49% 145% 265 145 the future 53 4 2007 2011 2016 2022 2007 2011 2016 2022 Anhanguera is expected reach its 2016 guidance of 750k students Source: Company’s Data / Insper student’s estimates

  15. 3. Financial Analysis 3.3 Projected EBITDA and EBITDA Margin Increases in margins sustain expected EBITDA growth EBITDA Margin Evolution EBITDA (BRL Million) 28% 818 Forecast Initial decrease in EBITDA margin, due 26% 705 to inefficient acquired units... 584 Low margin 24% acquired units 501 22% 381 ... Next, acquisitions 328 integration and 20% campuses 235 - M&A Integration maturation sustain a 188 - Campuses Maturation 4 percentage points 18% expansion 16% 2009 2010 2011E 2012E 2013E 2014E 2015E 2016E 2009 2011E 2013E 2015E Margin growth will sustain our expected EBITDA growth Source: Company’s Data / Insper student’s estimates

  16. SECTION 4 Valuation

  17. 4. Valuation 4.1 How to Finance Growth? Three main variables financing Anhanguera’s expansion CAPEX (BRL Million) Cash and Cash Equivalents (BRL Million) F 550 Forecast 425 Acquisition CAPEX 346 959 305 285 268 are high on the first 864 139 following years due to acquisition... 2010 2011E 2012E 2013E 2014E 2015E 2016E 631 577 566 Acquisitions Maintanence and Expansion Net Debt / EBITDA 403 0.2x 2010 2011E 2012E 2013E 2014E 2015E 205 0.0x 2016E 2010 ...and are mainly -0.2x -0.4x -0.4x financed with cash -1.2x 2010 2011E 2012E 2013E 2014E 2015E 2016E -1.6x F Source: Company’s Data / Insper student’s estimates

  18. 4. Valuation 4.2 Weighted Average Cost of Capital WACC’s Breakdown Risk Free Rate 1 (US$) 3.5% Country Risk Cost of Equity Premium 2 (US$) (BRL) 80% 2.0% 14.7% Cost of Equity Market Risk Premium 3 (US$) WACC (BRL 5.0% Nominal) 14.0% Beta 4 1.20 Cost of Debt Cost of Debt Tax Rate 8% 20% Cost of Before Taxes 5 After Taxes Debt (BRL) (BRL) 12.5% 11.5% Notes: 1. Based on the American 10 year T-bond – Source: Bloomberg 2. Based on the JPM EMBI+ Brazil – Source: JPM Hub 3. Based on the historical difference between the S&P returns and the American 10 year T-bond – Source: Bloomberg 4. Based on the average beta of comparable companies – Source: Bloomberg / Insper Student’s Estimates 5. Based on the weighted average of Anhanguera’s nominal rate debt – Source: Company Data / Insper Student’s Estimates

Download Presentation
Download Policy: The content available on the website is offered to you 'AS IS' for your personal information and use only. It cannot be commercialized, licensed, or distributed on other websites without prior consent from the author. To download a presentation, simply click this link. If you encounter any difficulties during the download process, it's possible that the publisher has removed the file from their server.

Recommend


More recommend