
SLIDE 1
1
VALUE THROUGH GOLD
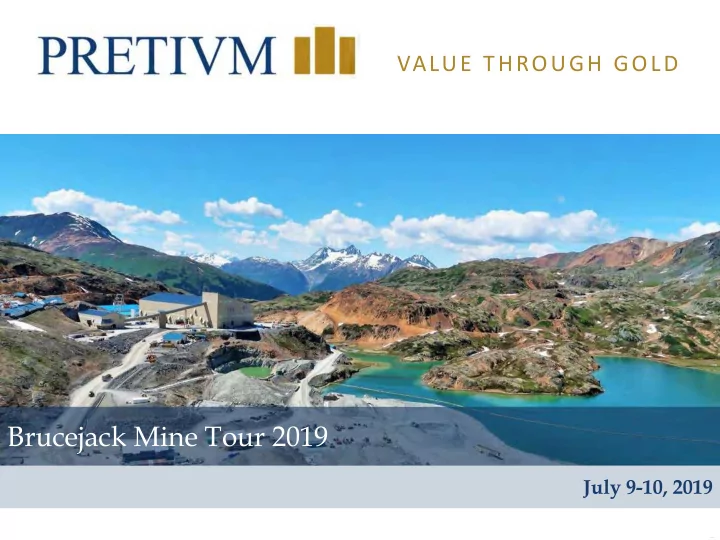
Brucejack Mine Tour 2019
July 9-10, 2019
Brucejack Mine Tour 2019 July 9-10, 2019 1 Cautionary Statement - - PowerPoint PPT Presentation
VALUE THROUGH GOLD Brucejack Mine Tour 2019 July 9-10, 2019 1 Cautionary Statement Forward-Looking Information This Presentation contains forward-looking information and forward looking statements future oriented financial
1
July 9-10, 2019
2
Forward-Looking Information
This Presentation contains “forward-looking information” and “forward looking statements” “future oriented financial information” and/or “financial outlooks” within the meaning of applicable Canadian and United States securities legislation (collectively herein referred to as “forward-looking information”). The purpose of disclosing future oriented financial information and financial outlooks is to provide a general overview of management’s expectations regarding the anticipated results of operations and costs thereof and readers are cautioned that future oriented financial information and financial outlook may not be appropriate for other purposes. Wherever possible, words such as “plans”, “expects”, “guidance”, “projects”, “assumes”, “budget”, “strategy”, “scheduled”, “estimates”, “forecasts”, “anticipates”, “believes”, “intends”, “modeled’, “targets” and similar expressions or statements that certain actions, events or results “may”, “could”, “would”, “might” or “will” be taken, occur or be achieved, or the negative forms of any of these terms and similar expressions, have been used to identify forward-looking information. Any statements that express or involve discussions with respect to predictions, expectations, beliefs, plans, projections, objectives, assumptions or future events or performance are not statements of historical fact and may be forward-looking statements. Forward-looking information may include, but is not limited to, information with respect to: the estimation of Mineral Reserves and Resources, including the updates thereto; realization of Mineral Reserve and Resource estimates; our estimated life of mine and life of mine plan for the Brucejack Mine; production and processing estimates; capital, sustaining and operating cost estimates and timing thereof; estimated economic results of the Brucejack Mine, including net cash flow and net present value; the expected grade of gold and silver production; predicted metallurgical recoveries for gold and silver; geological and mineralization interpretations; development of the Brucejack Mine; the Brucejack Mine production rate and the ramp-up to 3,800 tonnes per day production rate; capital modifications and upgrades, underground development, and estimated expenditures and timelines in connection therewith, including with respect to the ramp-up to 3,800 tonnes per day production rate; our planned mining (including mining methods), expansion, exploration and development activities, including our infill, expansion and underground exploration drill programs and our grassroots exploration program, and the results, costs and timing thereof; timelines and similar statements relating to the economic viability of the Brucejack Mine, including mine life, total tonnes mined and processed and mining operations; production and cost guidance; our operational grade control program, including plans with respect to our infill drill program and our local grade control model; grade reconciliation, updated geological interpretation and mining initiatives with respect to the Brucejack Mine; our operational strategy;
thereof; the future price of gold and silver; our liquidity and the adequacy of our financial resources; our intentions with respect to our capital resources; results, analyses and interpretations of exploration and drilling programs; timing, receipt, and anticipated effects of, and anticipated capital costs in connection with approvals, consents and permits under applicable legislation; litigation matters; environmental matters; our effective tax rate and the recognition of our previously unrecognized income tax attributes; statements regarding United States dollar cash flows, currency fluctuations and the recurrence of foreign currency translation adjustments; plans regarding our compensation policy and practices; and management and board of directors succession plans. Forward-looking information is subject to a variety of known and unknown risks, uncertainties and other factors that could cause actual events or results to materially differ from those expressed or implied by the forward-looking information, including, without limitation, those related to: uncertainty as to the
under our Offtake Agreement; assumptions regarding expected capital costs, operating costs and expenditures, production schedules, economic returns and other projections; our production and production cost estimates, including the accuracy thereof; commodity price fluctuations, including gold price volatility; the accuracy of our Mineral Resource and Reserve estimates (including with respect to size, grade and recoverability) and the geological, operational and price assumptions on which they are based; our ability to maintain or increase our annual production of gold at the Brucejack Mine or discover, develop or acquire Mineral Reserves for production; dependency on the Brucejack Mine for our future operating revenue; the development of our properties; general economic conditions; the inherent risk in the mining industry; and significant governmental regulations, including environmental regulations; and such other risks, uncertainties and factors as are identified in our Annual Information Form dated March 28, 2019, Form 40-F dated March 28, 2019, most recently filed MD&A and
Commission’s (“SEC”) website at www.sec.gov (collectively, the “Pretivm Disclosure Documents”). This list is not exhaustive of the factors that may affect any of our forward-looking
be difficult to predict and beyond our control. In connection with the forward-looking information contained in this Presentation, we have made certain assumptions about, among other things: our business and that no significant events will occur outside of our normal course of business; planned exploration and development activities and the costs and timing thereof; future prices of gold and silver and other metal prices; the accuracy of our Mineral Resource and Mineral Reserve estimates; the geology and mineralization of the Brucejack Project;
statements relating to the economic viability of the Brucejack Project; timing and receipt of governmental, regulatory and third party approvals, consents, licenses and permits; obtaining required renewals for existing approvals, consents, licenses and permits; the adequacy of our financial resources and our ability to raise any necessary additional capital on reasonable terms; our ability to satisfy the terms and conditions of our debt obligations; commodity prices; currency exchange rates and interest rates; political and regulatory stability; requirements under applicable laws; market competition; sustained labour stability and availability of equipment; positive relations with local groups; favourable equity and debt capital markets; stability in financial and capital markets; and such other factors and assumptions as are set out in the Pretivm Disclosure Documents. The foregoing list of assumptions and factors is not
regulatory, competitive and other risks and uncertainties, contingencies and other factors that could cause actual actions, events, conditions, results, performance or achievements to be materially different from those projected in the forward-looking information. Forward-looking information is not a guarantee of future performance. There can be no assurance that forward-looking information will prove to be accurate, as actual results and future events could differ materially from those anticipated in such information. We do not assume any
events and such forward-looking information, other than as required by applicable law. For the reasons set forth above, readers should not place undue reliance on forward-looking information.
3
Scientific and Technical Disclosure Certain technical and scientific information contained herein relating to the Brucejack Project is derived from, and in some instances is an extract from, the Company’s National Instrument 43-101 – Standards of Disclosure of Mineral Projects (“NI 43-101”) – technical report (the “2019 Report”) entitled “Technical Report on the Brucejack Gold Mine, Northwest British Columbia” with an effective date of April 4, 2019 prepared for Pretivm by Ivor W.O. Jones, M.Sc., P.Geo., FAusIMM, CP(Geo) of Ivor Jones Pty Ltd., Mark Horan, P.Eng. of Tetra Tech Canada Inc. (“Tetra Tech”), Jianhui (John) Huang, Ph.D., P.Eng. of Tetra Tech, Hassan Ghaffari, P.Eng. of Tetra Tech, Maritz Rykaart, Ph.D., P.Eng. of SRK Consulting (Canada) Inc., Rolf Schmitt, M.Sc., P.Geo. of Environmental Resources Management, Alison Shaw, Ph.D., P.Geo. of Lorax Environmental Services Ltd., Hamish Weatherly, M.Sc., P.Geo. of BGC Engineering Inc. (“BGC”), Trevor Crozier, M.Eng., P.Eng. of BGC, Catherine Schmid, M.Sc., P.Eng. of BGC and Ed Carey, P.Eng. of BGC. The 2019 Report is the
2019 Report, which has been filed with certain Canadian securities regulatory authorities pursuant to NI 43-101. The 2019 Report is available for review under the Company’s profiles
reviewed, approved and verified by Kenneth C. McNaughton, M.A.Sc., P.Eng., our Vice President and Chief Exploration Officer, Lyle Morgenthaler, B.A.Sc., P.Eng., our Chief Mine Engineer, Warwick Board, Ph.D., P.Geo, Pr.Sci.Nat., our Vice President, Geology and Chief Geologist, and Nicolas Scarcelli-Casciola, B.A.Sc., P.Eng., our Mine Planning Manager, each
Mineral resources which are not mineral reserves do not have demonstrated economic viability. The estimate of mineral resources may be materially affected by environmental, permitting, legal, title, taxation, socio-economic, marketing, political or other relevant issues. There is no guarantee that all or any part of the mineral resource will be converted into mineral reserves. Technical disclosure set out in this Presentation has not been prepared in accordance with the requirements of United States securities laws and uses terms that comply with reporting standards in Canada with certain estimates prepared in accordance with NI 43-101. NI 43-101 is a rule developed by the Canadian Securities Administrators that establishes standards for all public disclosure an issuer makes of scientific and technical information concerning mineral projects. Unless otherwise indicated, all Mineral Reserve and Mineral Resource estimates contained in this Presentation have been prepared in accordance with NI 43-101 and the Canadian Institute of Mining, Metallurgy and Petroleum Classification System. Canadian standards, including NI 43-101, differ significantly from the requirements of the SEC under its Industry Guide 7 (“Guide 7”), and Mineral Reserve and Resource information contained in this Presentation may not be comparable to similar information disclosed by United States companies reporting pursuant to Guide 7. In particular, and without limiting the generality of the foregoing, the term “resource” does not equate to the term “reserves”. Under Guide 7, mineralization may not be classified as a “reserve” unless the determination has been made that the mineralization could be economically and legally produced or extracted at the time the reserve determination is made and volumes that are not “reserves’ should not be disclosed. Among other things, all necessary permits would be required to be in hand or issuance imminent in order to classify mineralized material as reserves under Guide 7. Accordingly, Mineral Reserves estimates included in this Presentation may not qualify as “reserves” under Guide 7. Guide 7’s current disclosure standards normally do not permit the inclusion of information concerning “Measured Mineral Resources”, “Indicated Mineral Resources” or “Inferred Mineral Resources” or other descriptions of the amount of mineralization in mineral deposits that do not constitute “reserves” by Guide 7 standards in documents filed with the SEC. United States investors should also understand that “Inferred Mineral Resources” have a great amount of uncertainty as to their existence and great uncertainty as to their economic and legal feasibility. It cannot be assumed that all or any part of “Mineral Resources”, “Indicated Mineral Resources” or “Inferred Mineral Resource” will ever be upgraded to a higher category. Under Canadian rules, estimated “Inferred Mineral Resources” may not form the basis of feasibility or pre-feasibility studies except in rare cases. Investors are cautioned not to assume that all or any part of the “Mineral Resources”, “Measured Mineral Resources”, “Indicated Mineral Resources” or “Inferred Mineral Resource” reported in this Presentation exists or is economically or legally
that does not constitute “reserves” by Guide 7 standards as in-place tonnage and grade without reference to unit measures. Investors are specifically cautioned not to assume that all or any part of the mineral deposits in these categories will ever be converted into Guide 7-defined mineral reserves. In addition, the definitions of “Proven Mineral Reserves” and “Probable Mineral Reserves” under reporting standards in Canada differ in certain respects from the standards of Guide 7. Accordingly, information concerning mineral deposits set forth or incorporated by reference herein may not be comparable with information made public by companies that report in accordance with Guide 7. Non-IFRS Financial Performance Measures This Presentation includes certain non-IFRS measures. The Company believes that these measures, in addition to measures prepared in accordance with International Financial Reporting Standards (“IFRS”), provide readers an improved ability to evaluate the underlying performance of the Company and to compare it to information reported by other companies. Management uses these measures for internal valuation for the period and to assist with planning and forecasting of future operations. The non-IFRS measures are intended to provide additional information and should not be considered in isolation or as a substitute for measures of performance prepared in accordance with
Company’s latest MD&A for further details, including an explanation, discussion and reconciliation of non-IFRS measures. Currency Unless otherwise indicated, all dollar values herein are in United States dollars.
4
Time Event
6:00 a.m. 8:30 a.m. Flight: Vancouver to Bowser Airstrip 8:30 a.m. 9:00 a.m. Helicopter safety briefing, fly to Brucejack 9:00 a.m. 9:45 a.m. Safety briefing & site orientation Underground & surface presentations 9:45 a.m. 11:45 a.m. Safety gear-up Underground Tour 11:45 a.m. 12:30 p.m. Lunch General discussion & questions 12:30 p.m. 2:30 p.m. Safety gear-up Mill Tour 2:30 p.m. 3:00 p.m. Helicopter to Bowser Airstrip 3:00 p.m. 6:00 p.m. Flight: Bowser Airstrip to Vancouver
5
6
7
Mill Building Valley of the Kings Portal Powerline Main Camp Brucejack Lake Contact Water Pond West Zone Portal Diesel Backup
8
– $2.6 billion NPV5 (at $1,300 gold, post-tax) – 6.4 million ounces of gold Proven & Probable – 16 million tonnes at a grade of 12.6 g/t gold
– Over 520,000 ounces average annual gold production – All-in Sustaining Costs: $615/ounce of gold sold – $350 million average annual operating cash flow – $1.7 billion total operating cash flow
– Over 525,000 ounces average annual gold production – All-in Sustaining Costs: $535/ounce of gold sold
Source: See News Releases dated April 4, 2019.
9
Q1 2019 Actual 2019 Guidance Gold Production 79,180 390,000 - 420,000 oz Mill Throughput Rate 3,279 tpd 3,500 tpd Average Head Grade 8.7 g/t 10.4 g/t All-in Sustaining Cost1 $868 /oz sold $775 - $875 /oz sold
Source: See News Releases dated Feb 14, 2019 & May 2, 2019 and refer to Company’s Financial Statements and MD&A. (1) Non-IFRS performance measure. For reconciliation to IFRS measures refer to the Company’s MD&A.
10
50,000 100,000 Q3 2017 Q4 2017 Q1 2018 Q2 2018 Q3 2018 Q4 2018 Q1 2019 $0.0 $20.0 $40.0 $60.0 $80.0 Gold Ounces Sold Millions USD Ounces Sold Cash Flow From Operations
Q1 2019 $39.9M
Source: See News Releases dated Nov 10, 2017, Mar 8, 2018, May 10, 2018, Aug 9, 2018, Nov 8, 2018, Feb 14, 2019 & May 2, 2019 and refer to Company’s Financial Statements and MD&A.
Positive Cash Flow Since Start-Up
11
12
reporting with the relevant reporting standards and terminology (GRI)
factors
data
13
Pretivm Employees as of Apr 2019
Brucejack Mine
14
15
West Zone
Au (g/t)
5-50 50-350 350-1500 >1500 Underground development
30 m High-grade Corridors
2019 Drilling – Phase 2 Target Area 2019 Drilling - Phase 1 Target Area
16
Silcap Underground development High-grade corridor
> 20 g/t drill intersection Underground visible gold
N
17
Silcap Underground development High-grade Corridor
> 20 g/t drill intersection Underground visible gold
N
18
West Zone Portal UG Crusher Truck Loop
Valley of the Kings Portal
Ventilation Raises
Decline Incline 1470 1440 1410 1380 1350 1320 1290 1260 1230 1200 1140 1110 1080 1170
Incline
Current Mining Horizons 1200 - 1410 Next Mining Horizons 1080 - 1170 1 2 3 4
Underground Tour Stops 1) Longhole RC Drill & Sampling 2) Electrum & Structure 3) Electrum & Structure 4) Main Decline
19
Valley of the Kings Portal
Ventilation Raises
Decline Incline 1470 1440 1410 1380 1350 1320 1290 1260 1230 1200 1140 1110 1080 1170
Current Mining Horizons 1200 - 1410 Next Mining Horizons 1080 - 1170 1 2 3 4
Underground Tour Stops 1) Longhole RC Drill & Sampling 2) Electrum & Structure 3) Electrum & Structure 4) Main Decline
20
21
22
1380-21 W Mined Early Q2 1380-21 E Mined End of Q2
Corridor Continues
1380-21 W Mined Early Q2
N
23
1350-11 Mining Q3
Corridor Continues N
24
1260 12 NW Mined Mid Q2 1260 12 SE Mining Early Q3 Development allows for mining along structure 1260 12 NW Mined Mid Q2 N
25
Development at March 2019 Development at March 2019
Current Development
N
26
27
Isometric view facing North
Truck Dump Crusher Transfer Station West Zone Portal Valley of the Kings Portal
28
29
VOK Portal Mill Camp
Waste Rock Disposal Contact Water Pond
West Zone Portal
30
(1) Production rate increase to 3,800 t/d from 2,700 t/d. See News Release dated Dec 21, 2018.
96.7% GOLD RECOVERY (LOM)
Two Thirds of Total Gold Production One Third of Total Gold Production
31
32
33
Process and fire water tanks
34
35
36
N
250 m
(1) Outline of Measured, Indicated, and Inferred Mineral Resource, based on NI 43-101 dated Apr 4, 2019 (2) Regional exploration drill results; see News Release dated Oct 8, 2015
SU-657 SU-666
2.05m @ 2,100 g/t Au (Inc 0.5m @ 8,600 g/t Au) 9.0m @ 21.87 g/t Au (Inc 0.5m @ 203 g/t Au)
Indicated Resource1 Inferred Resource1 Exploration Potential Drill Intercepts3
~450 m ~1000 m
SU-654
1.5m @ 16.9 g/t Au
SU-668
0.5m @ 1.37 g/t Au
SU-658
1.18m @ 10.75 g/t Au
37
Incline 1440 1410 1380 1350 1320 1290 1260 1230 1200 1140 1110 1080 1170
PHASE 1 DRILLING PHASE 3 DRILLING PHASE 4 DRILLING PHASE 2 DRILLING
38
Flow Dome Zone
SU-666 9.0m @21.87 g/t Au (Inc 0.5m @ 203 g/t Au 2.05m @2,100 g/t Au (Inc 0.5m @ 8,600 g/t Au
OPEN
Anomalous Cu and Mo
SU-657
OPEN
Valley of the Kings
(1) 2019 Underground Exploration Drilling; see News Release dated June 5, 2019. (2) 2018 Underground Exploration Drilling; see News Release dated June 18, 2018 (3) 2015 Regional Drill program; see News Release dated Oct 8, 2015 (4) Outline of Measured, Indicated, and Inferred Mineral Resource, based on NI 43-101 dated Apr 4, 2019
2015 Drilling3 2019 Deep Hole Drilling1
107.5m @5.56 g/t Au (Inc 1.5m @185.5 g/t Au) VU-1787
Underground Development
2018 Drilling2
VU-1785 VU-820 VU-911
OPEN
Indicated Resource4 Exploration Potential Measured Resource4 500 m Au (g/t) 0.5-1.0 1.0-5.0 5.0-20.0 >20.0 Inferred Resource4
39
Flow Dome Zone
Valley of the Kings
(1) 2019 Underground Exploration Drilling; see News Release dated July 9, 2019 (2) Outline of Measured, Indicated, and Inferred Mineral Resource, based on NI 43-101 dated Apr 4, 2019
3rd 2019 Deep Drill Hole1 VU-2019
Underground Development
2018 Drilling
Anomalous Cu and Mo
Indicated Resource2 Measured Resource2 500 m CSMT Resistivity Inferred Resource2 250 ohm/m 500 ohm/m 750 ohm/m 1000 ohm/m
Low Resistivity CSMT Anomaly
40
30 km
Regional exploration program; see News Release dated June 5, 2019
5 km 2018 Drill Hole Collar
Kirkham Zone Koopa Zone Canoe Zone American Creek Zone Claim Outline A6 Zone Virginia K Zone
41
Solid Q1 performance provides
Updated Mineral Reserve and
Updated Life of Mine plan
42
PVG : TSX/NYSE
pretivm.com
43
(1) As of July 5, 2019; ownership calculated on an undiluted basis. (2) As of July 5, 2019. Source: IPREO, Morningstar Inc. & SEDAR.
Top Shareholders(2)
(% S/O)
Van Eck Associates
12.3
BlackRock Asset Management
8.4
Letko, Brosseau & Associates
7.9
Rothschild Asset Management
3.7
BMO Asset Management
2.9
Orion Mine Finance
2.5
The Vanguard Group
2.4
Franklin Advisors
1.9
Pretivm Management
1.9 Equity Structure(1)
(shares in millions)
Issued & Outstanding 184.5 Fully Diluted 195.9
Market Cap (July 5, 2019) US$1.86B Analyst Coverage
Alliance Global Partners Bhakti Pavani
Adam Graf BMO Andrew Kaip CIBC Anita Soni Canaccord Kevin MacKenzie Citi Alexander Hacking Cormark Securities Richard Gray Global Mining Research David Radclyffe H.C. Wainwright Heiko F. Ihle Numis Jonathan Guy RBC Mark Mihaljevic Roth Capital Partners Joseph Reagor Scotiabank Ovais Habib
44
Source: See News Releases dated May 2, 2019 and refer to Company’s Financial Statements and MD&A. (1) Non-IFRS performance measure. For reconciliation to IFRS measures refer to the Company’s MD&A.
Q1 2019 YR 2019 Guidance
Gold Ounces Sold
81,434 oz 390,000 – 420,000 oz
Total Cash Costs1
$55.8 M $255 - 265 M
Sustaining Capital Expenditures
$3.7 M $27 – 30 M
Treatment and Refinery Charges
$5.1 M $22 - 23 M
Accretion on DRP, Site Share-Based Compensation & Lease Obligations
$2.2 M $6 - 7 M
Corporate and Administrative
$3.9 M $15 - 16 M
Total AISC1
$70.7 M $325 - 341 M
Per Ounce Sold1
$868/oz $775 – 875/oz
45
Category Tonnes
(mil)
Gold
(g/t)
Silver
(g/t) Contained
Gold
(mil oz)
Silver
(mil oz)
Proven 1.4 7.2 383 0.3 17.4 Probable 1.5 6.5 181 0.3 8.6 Total P&P 2.9 6.9 279 0.6 26.0
Valley of the Kings1 West Zone2
(1) Source: see news release dated April 4, 2019 (2) Source: June 19, 2014 Feasibility Study & Mineral Reserve Updated, see news release dated December 15, 2016
Category Tonnes
(mil)
Gold
(g/t)
Silver
(g/t) Contained
Gold
(mil oz)
Silver
(mil oz)
Proven 2.0 11.2 11.8 0.7 0.7 Probable 11.1 14.3 10.5 5.1 3.8 Total P&P 13.1 13.8 10.7 5.8 4.5
46
(1) See News Release dated April 4, 2019 (2) See News Release dated June 19, 2014
Category Tonnes
(mil)
Gold
(g/t)
Silver
(g/t) Contained
Gold
(mil oz)
Silver
(mil oz)
Valley of the Kings – April 2019(1) Measured 1.8 17.15 16.4 1.0 1.0 Indicated 11.9 17.15 15.4 6.6 5.9 M&I 13.7 17.15 15.5 7.6 6.8 Inferred 3.8 17.07 19.4 2.2 2.4 West Zone – Dec 2013(2) Measured 2.4 5.85 347 0.5 26.8 Indicated 2.5 5.86 190 0.5 15.1 M&I 4.9 5.85 267 0.9 41.9 Inferred 4.0 6.44 82 0.8 10.6
47
Select Operating Results
Source: See News Releases dated May 2, 2019 and refer to Company’s Financial Statements and MD&A.
Three months ended March 31, 2019 2018 Ore mined t 308,387 268,339 Mining rate tpd 3,427 2,982 Ore milled t 295,122 261,443 Head grade g/t Au 8.7 9.1 Recovery % 96.8 96.8 Mill throughput tpd 3,279 2,905 Gold ounces produced
79,180 75,689 Silver ounces produced
108,234 94,730 Gold ounces sold
81,434 68,651 Silver ounces sold
96,974 84,234
The following abbreviations were used above: t (tonnes), tpd (tonnes per day), g/t (grams per tonne), Au (gold) and oz (ounces).
48
Select Financial Results
Source: See News Releases dated May 2, 2019 and refer to Company’s Financial Statements and MD&A.
Three months ended March 31,
(In thousands of US dollars, except per share or per oz)
2019 2018 Revenue $ 103,119 89,422 Earnings from mine operations(1,2) $ 29,152 16,834 Net gain (loss) for the period $ 4,166 (8,058) Per share - basic $/share 0.02 (0.04) Per share - diluted $/share 0.02 (0.04) Adjusted earnings (loss) (2) $ 16,527 5,797 Per share - basic (2) $/share 0.09 0.03 Total cash and cash equivalents $ 50,868 70,540 Cash generated from (used by)
$ 39,944 24,719 Total assets $ 1,625,855 1,678,657 Long-term debt(3) $ 444,830 292,906 Total cash costs (2) $/oz 686 841 All-in sustaining costs (1,2) $/oz 868 1,009 Average realized price (1,2) $/oz 1,257 1,271 Average realized cash margin (1,2) $/oz 571 430
(1) Refer to the "Non-IFRS Financial Performance Measures" section at the end of this news release. (2) Long-term debt does not include the current portions of the Company’s Loan Facility and Offtake Obligation (each as defined
in the MD&A) in the amount of $84,375 as at March 31, 2019. For the comparable period in 2018, long-term debt does not include the current portions of the Company’s Construction Credit Facility (as defined in the MD&A) and Offtake Obligation in the amount of $388,068.