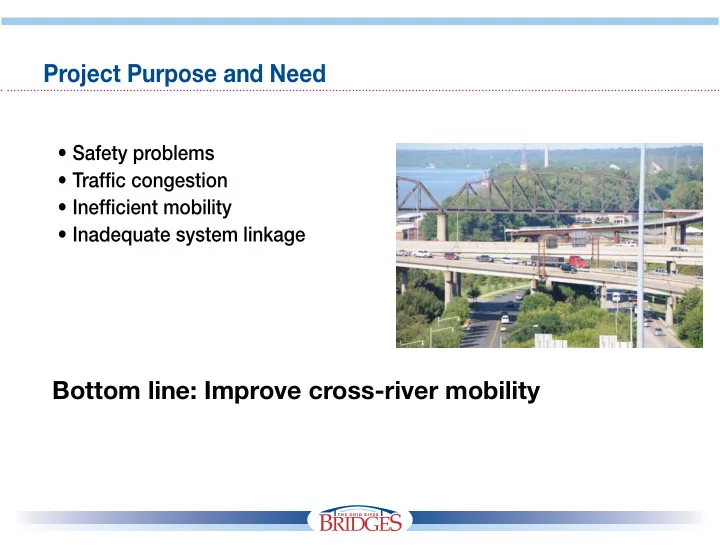
SLIDE 1 Project Purpose and Need
- Safetyproblems
- Traffjccongestion
- Ineffjcientmobility
- Inadequatesystemlinkage
Bottom line: Improve cross-river mobility
SLIDE 2
Traffic Volume – Vehicle Crossings Per Day Bridge Original 2010 2030 2030 2030 capacity no-action w/2003 w/2011 Alternative Alternative w/tolls(2) Kennedy(1)I-65 80,000 122,000 155,000 136,000 104,000 ShermanMintonI-64 80,000 82,000 112,000 100,000 122,000 ClarkMemorialUS31 22,000 25,000 28,000 35,000 (2ndSt.Bridge) EastEndBridge 0 60,000 52,000
Project Purpose and Need
(1)
Currently approximately 20% truck traffic; original capacity would have been for 5%-8% truck traffic
(2)Study based on tolls of $1.50 car, $3 small truck, $6 large truck (these are not proposed rates
but were used for study purposes only) A key purpose and need for the project is to alleviate traffic crossing the downtown bridges by building a new bridge for northbound traffic and converting the existing Kennedy Bridge to southbound-only traffic.
SLIDE 3
SLIDE 4
SLIDE 5 Environmental Resources
Alternativesevaluated basedonfollowing environmentalfactors:
- WaterResources
- BiologicalResources
- ContaminatedMaterials
- AirQuality
- Noise
- Energy
SLIDE 6 Environmental Resources
Alternativesevaluated basedonfollowing environmentalfactors:
- LandUse
- Social/Economic
- Historic/Cultural
- Parks
- EnvironmentalJustice
SLIDE 7
Social/Economic – acquisitions resulting as part of the Project Typeofproperty 2003Alternative 2011Alternative Difference Business&Nonprofjt 80 24 56fewerproperties Organizations Residential 80 70 10fewerhomes Agriculture 18 18 Nodifference
Environmental Impact
The 2011 Modified Alternative has less of an environmental impact than the 2003 Selected Alternative.
SLIDE 8
SLIDE 9
SLIDE 10
SLIDE 11
SLIDE 12
SLIDE 13
SLIDE 14
SLIDE 15
SLIDE 16
SLIDE 17
SLIDE 18
SLIDE 19
SLIDE 20
SLIDE 21
SLIDE 22
SLIDE 23
SLIDE 24
SLIDE 25
SLIDE 26
SLIDE 27
SLIDE 28
SLIDE 29
SLIDE 30
SLIDE 31
SLIDE 32
SLIDE 33
SLIDE 34
SLIDE 35