
SLIDE 1
Normal Normal Osteoporosis Osteoporosis
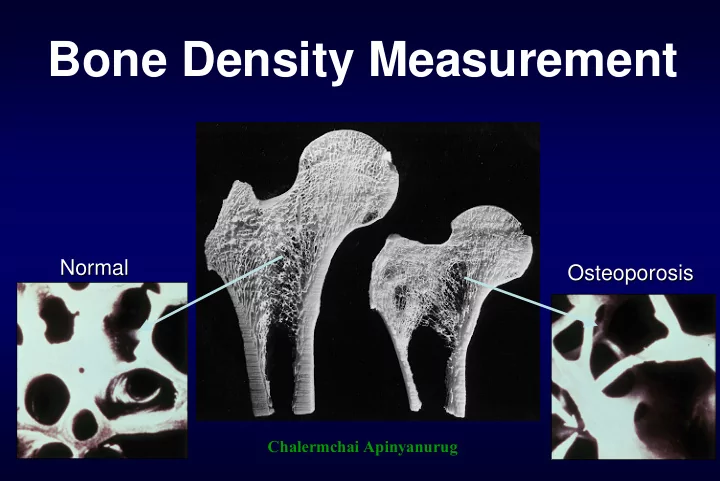
Bone Density Measurement Normal Normal Osteoporosis Osteoporosis - - PowerPoint PPT Presentation
Bone Density Measurement Normal Normal Osteoporosis Osteoporosis Chalermchai Apinyanurug Who should receive BMD testing? National Osteoporosis North American Menopause American Association of Foundation Society Clinical Endocrinolgist
Normal Normal Osteoporosis Osteoporosis
National Osteoporosis Foundation North American Menopause Society American Association of Clinical Endocrinolgist
with ≥ 1 risk factor
present with fractures
medical causes of bone loss
with ≥ 1 risk factor
who have sustained a fracture unrelated to major trauma
women who have risk factors for fracture or bone loss
Women discontinuing estrogen should be considered for bone density testing according to the indications listed above
density
using standard x-ray
x-ray system (need computer and scanner)
Advantage
Disadvantage
(High specificity but low sensitivity)
– Positioning – Bone edges – Analysis regions – Artifacts
– Reduce errors – Better scan evaluation
– Previous results – Reference Data Comparison – Trending – Bone strength assessments
Osteoporosis International. January, 2006
Osteoporosis International. January, 2006
Underwater Weighing (Hydrodensitometry) DXA (Dual-energy X-Ray Absorptiometry) BIS Near Infrared Interactance Air Displacement Imaging Methods (CT, MRI) Anthropometry BIA (Bioelectrical Impedance Analysis)
regimens.
with cardiovascular disease
triglycerides
Ragi et al. ASBMR 2005
ASBMR 2005
Osteoporosis
Normal Bone Mass
Low Bone Mass (Osteopenia)
Assessment of Fracture Risk and Its Application to Screening For Postmenopausal Osteoporosis WHO Study group; 1994.
Correlates With Lifetime Fracture Risk for Caucasian Women
Osteoporosis Self-Assessment Tool for Asians (OSTA) Research Group Osteoporos Int 2001;12:699-705
1465 40-89 90 66 23
135 57-80 97 43 34
Khon Kaen Songkhla 322 388 45-84 43-91 97 93 (93) 54 61 (30) 21 24 (15)
860 45-88 91 45 21
722 1127 1101 43-81 88 54 34
47-91 90 38-43 NA
48-87 87 67 24
Sens: Sensitivity, Spec: Specificity, PPV: Positive predictive value
Age (y) Score Weight (kg) Score < 45 45 - 49 50 - 54 55 - 59 60 - 64 65 - 69 70 - 74 75 - 79 80 - 84 85 – 89 > 90 + 7.5 + 6.0 + 4.5 + 3.0 + 1.5
< 30 30 - 34 35 - 39 40 - 44 45 - 49 50 - 54 55 - 59 60 - 64 65 - 69 70 - 74 75 - 79 80 - 84 85 - 89 > 90
+ 2 + 4 + 6 + 8 + 10 + 12
1- Specificity
0.0 0.2 0.4 0.6 0.8 1.0Sensitivity
0.0 0.2 0.4 0.6 0.8 1.0AUC 0.85
Pongchaiyakul C. J Med Assoc Thai 2004;87:910-6.
Weight (kg) < 45 45-49 50-54 55-59 60-64 65-69 70-74 75-79 80-84 85-89 > 90
< 30 58.7 67.4 75.0 81.3 86.3 90.2 93.0 95.1 96.6 97.6 98.3 30-34 47.5 56.8 65.6 73.5 80.1 85.4 89.5 92.5 94.7 96.3 97.4 35-39 36.6 45.6 54.9 63.8 71.9 78.8 84.4 88.7 91.9 94.3 96.0 40-44 26.9 34.8 43.6 52.9 62.0 70.3 77.5 83.3 87.9 91.3 93.9 45-49 19.0 25.4 33.0 41.7 51.0 60.2 68.7 76.1 82.2 87.0 90.7 50-54 13.0 17.8 23.9 31.3 39.8 49.0 58.3 67.0 74.6 81.0 86.1 55-59 8.7 12.1 16.7 22.5 29.7 38.0 47.1 56.4 65.2 73.1 80.0 60-64 5.7 8.1 11.3 15.6 21.2 28.1 36.2 45.1 54.4 63.4 71.6 65-69 3.7 5.3 7.5 10.5 14.6 19.9 26.5 34.4 43.2 52.5 61.6 70-74 2.4 3.4 4.9 7.0 9.8 13.7 18.7 25.0 32.6 41.3 50.5 75-79 1.5 2.2 3.2 4.6 6.5 9.2 12.8 17.5 23.6 30.9 39.4 80-84 1.0 1.4 2.1 3.0 4.2 6.0 8.5 11.9 16.4 22.2 29.3 85-89 0.6 0.9 1.3 1.9 2.7 3.9 5.6 7.9 11.1 15.4 20.9 > 90 0.4 0.6 0.8 1.2 1.8 2.5 3.6 5.2 7.4 10.4 14.4
Age (yr)
High risk Intermediate risk Low risk
10 20 30 40 50 60
Prevalence of osteoporosis by DXA (%) OSTA Score QUS of calcaneus (T-score)
<-2.5 >-2.5 Low risk (>-1) High risk (<-1)
Figure 1. Prevalence of osteoporosis (by DXA) according to QUS of calcaneus and OSTA score
2.9 14.3 (OR: 5.6) 56.7 (OR: 43.7) 21.4 (OR: 9.1)
10 20 30 40 50 60 70
Prevalence of osteoporosis by DXA (%) KKOS Score QUS of calcaneus (T-score)
<-2.5 >-2.5 Low risk (>-1) High risk (<-1)
Figure 2. Prevalence of osteoporosis (by DXA) according to QUS of calcaneus and KKOS score
2.3 16.7 (OR: 8.6) 58.6 (OR: 60.9) 20.7 (OR: 11.2)
Osteoporosis International 2007;18(4):525-31.
QUS T-score (SD) Weight (kg) Age (yr)
50 0.49 0.33 0.20 0.12 0.07 55 0.59 0.43 0.28 0.17 0.10 60 0.68 0.53 0.37 0.23 0.14 65 0.77 0.63 0.47 0.32 0.19 70 0.83 0.72 0.57 0.41 0.27 75 0.88 0.79 0.67 0.51 0.35 80 0.92 0.85 0.75 0.61 0.45 85 0.94 0.90 0.82 0.70 0.55 50 0.28 0.17 0.10 0.05 0.03 55 0.37 0.24 0.14 0.08 0.04 60 0.47 0.32 0.20 0.11 0.06 65 0.57 0.41 0.27 0.16 0.09 70 0.67 0.51 0.36 0.22 0.13 75 0.75 0.62 0.45 0.30 0.18 80 0.82 0.71 0.56 0.40 0.25 85 0.87 0.78 0.65 0.50 0.34
50 kg 40 kg
Predicted probability of having osteoporosis for a given age, weight and QUS
Points
10 20 30 40 50 60 70 80 90 100
Age
35 45 55 65 75 85
Weight
95 90 85 80 75 70 65 60 55 50 45 40 35 30
QUS
4 3 2 1
Total Points
40 80 120 160 200 240 280
Linear Predictor
1 2 3 4 5
Risk of Osteoporosis
0.01 0.1 0.3 0.6 0.8 0.95 0.99
48 67 78
193
110
Easy Nomogram
Risk of Osteoporosis
Risk of osteoporosis
0.3 0.1 0.05 0.01 0.6 0.8 0.9 0.99
0.5
QUS T-scores Clinical risk scores