board end measures college board monitoring presentation
play

Board End Measures College Board Monitoring Presentation Board End - PDF document

Board End Measures College Board Monitoring Presentation Board End #1: Educational and Career Goal Success All students achieve the learning necessary to be successful in their educational and career goals. Board End #1, Outcome 1


  1. Board End Measures – College Board Monitoring Presentation Board End #1: Educational and Career Goal Success – All students achieve the learning necessary to be successful in their educational and career goals. Board End #1, Outcome 1 – Results Course Success Measure Definition: Percentage of all courses attempted by degree credit students per year receiving a grade of “C” or better. Included in this measure are the following degree types: Occupational Associate, Liberal Arts 
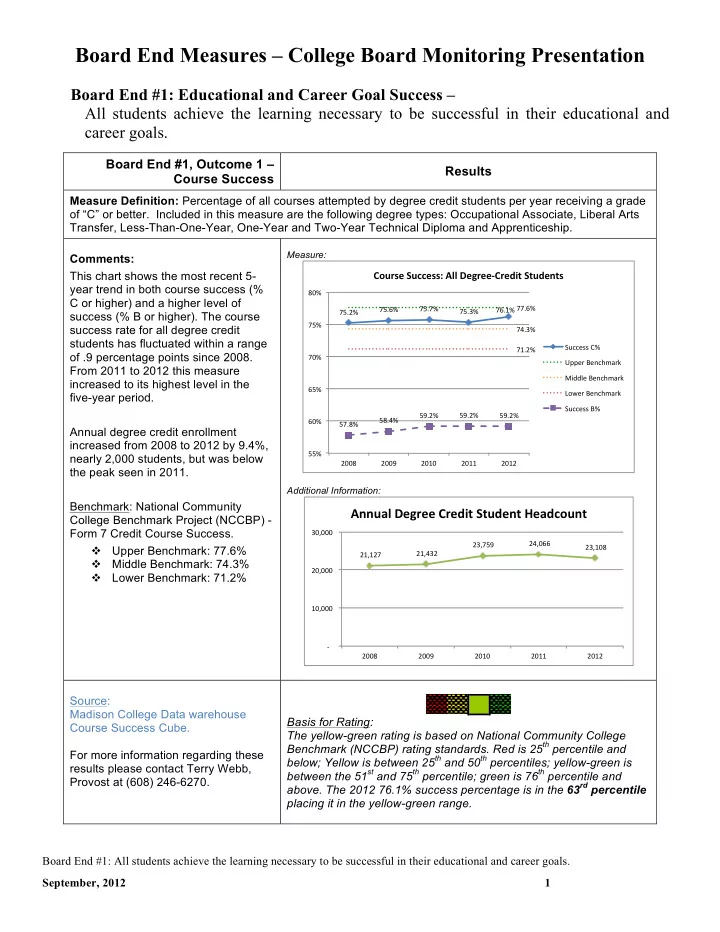
Transfer, Less-Than-One-Year, One-Year and Two-Year Technical Diploma and Apprenticeship. Measure: Comments: !"#$%&'(#))&%%*'+,,'-&.$&&/!$&012'(2#0&32%' This chart shows the most recent 5- year trend in both course success (% +-%& C or higher) and a higher level of !'#)%&!!#'%& !"#'%& !"#!%& !"#(%& !"#$%& success (% B or higher). The course !"%& success rate for all degree credit !*#(%& students has fluctuated within a range ./00122&3%& !)#$%& of .9 percentage points since 2008. !-%& 45516&71809:;6<& From 2011 to 2012 this measure =>??@1&71809:;6<& increased to its highest level in the '"%& ABC16&71809:;6<& five-year period. ./00122&7%& ",#$%& ",#$%& ",#$%& "+#*%& '-%& "!#+%& Annual degree credit enrollment increased from 2008 to 2012 by 9.4%, ""%& nearly 2,000 students, but was below $--+& $--,& $-)-& $-))& $-)$& the peak seen in 2011. Additional Information: Benchmark: National Community !""#$%&'()*((&+*(,-.&/.#,(".&0($,12#".& College Benchmark Project (NCCBP) - Form 7 Credit Course Success. !'*$***!! !"&$*++!! !"'$%()!! !"'$#*,!! v Upper Benchmark: 77.6% !"#$&'"!! !"#$#"%!! v Middle Benchmark: 74.3% !"*$***!! v Lower Benchmark: 71.2% !#*$***!! !-!!!! "**,! "**)! "*#*! "*##! "*#"! Source: Madison College Data warehouse Basis for Rating: Course Success Cube. The yellow-green rating is based on National Community College Benchmark (NCCBP) rating standards. Red is 25 th percentile and For more information regarding these below; Yellow is between 25 th and 50 th percentiles; yellow-green is results please contact Terry Webb, between the 51 st and 75 th percentile; green is 76 th percentile and Provost at (608) 246-6270. above. The 2012 76.1% success percentage is in the 63 rd percentile placing it in the yellow-green range. Board End #1: All students achieve the learning necessary to be successful in their educational and career goals. September, 2012 1

  2. Board End Measures – College Board Monitoring Presentation Board End #1, Outcome 2 – Results Graduation Measure Definition: 3-Year Graduation Rate – graduation rate of first-time full-time and part-time students entering in the fall semester. Comments: !"#$%&'%()&"*+","-)%$."/"0'11/2*3)" This measure is based on the National Community College Benchmark $"%& 2.34567&86//9:9& Project (NCCBP) Form 2 Completion -;//0<=9>&-4?5@0<=9& measure. It tracks 3-year graduation ("%& 47&-.//& rates for entering full-time, first-time ABB9?&C97DE=.?F& !"%& and part-time, first-time student '+#$%& cohorts. '"%& '"#'%& 2433/9&C97DE=.?F& ,!#$%& In the most recent cohort year, ,"%& Madison College is slightly below the !"#$%& '(#)%& '*#)%& upper benchmark for full-time students, "%& G6H9?&C97DE=.?F& and substantially above the upper -.//&'""*0"+& -.//&'""+0")& -.//&'"")0"1& benchmark for part-time students. The number of students in first time !"#$%&'%()&"*+","-)%$."/"0%$(/1*2)" full-time and part-time cohorts is shown on the bottom chart. The )$%& entering first-time, full-time cohort grew 2.34567&86//9:9& ;.<=0>?9@&-4<5=0>?9& by 19 students (1.3%) while the +$%& 47&-.//& entering first-time, part-time cohort ABB9<&C97DE?.<F& grew by 60 students (7.1%). ,$%& !"#$%& !*#"%& !$%& 2433/9&C97DE?.<F& '(#)%& ''#!%& '$%& *#)%& +#!%& G6H9<&C97DE?.<F& $%& -.//&!$$*0$"& -.//&!$$"0$1& -.//&!$$10$(& !"#$%&'"()*+,%)#",-*./0/#%* !'#***!! !"#,**!! !"#&&$!! !"#&'&!! !"#$%"!! -1234!5167!-5! !"#***!! -1234!5167!85! !)*'!! !(&'!! !(")!! !,**!! !+!!!! -.//!'**%+*0! -.//!'**0+*(! -.//!'**(+*)! Board End #1: All students achieve the learning necessary to be successful in their educational and career goals. September, 2012 2

  3. Board End Measures – College Board Monitoring Presentation Full-Time: 73 rd percentile Sources: 1. IRE custom SAS program running on extracted cohort information. 2. Madison College Data Warehouse Part-Time: 94 th percentile FTE & Enrollment Cube. Benchmark Source: 1. NCCBP: Form 2: 3-year Cohort Graduation Rate for Entering Full- Basis for Rating: Time and Part-Time students. Percentile ranking based on benchmarks as with previous measure. For more information regarding these results please contact Terry Webb, Provost at (608) 246-6270. Board End #1: All students achieve the learning necessary to be successful in their educational and career goals. September, 2012 3

  4. Board End Measures – College Board Monitoring Presentation Board End #1, Outcome 3 – Results Overall Student Success Measure Definitions: § 3-Year Cohort Graduation Rate + Transfer Rate + Retention Rate. Total of the graduation rate, transfer rate and retention rate of first-time students entering in the fall semester, 3 years after first enrollment - excludes students in programs less than 1 year in length and apprenticeships (no benchmarks available); § Cohort 3-year percent of all first-time, full-time students and first-time part-time students; § Two re-enrollment measures of all degree credit students: 1. Fall to Spring Persistence. 2. Fall to Fall Retention. Comments: Cohort year information on each chart shows the year !"#$""%&$"'()%*)+'",)%*+--"..%/%0% that students first took a Madison College degree /1"2$% credit class. Students are followed for 3 years and -*%& their success in graduation, retention, or transfer is '!#"%& "$#'%& "-#!%& "-#$%& ")#-%& '*%& recorded. Combining the results for a student cohort’s +*#!%& !$#"%& !)#'%& !)#!%& !)#)%& graduation, transfer and retention rates reveals the ,*%& ++#(%& ++#+%& +,#-%& +,#+%& ++#)%& overall student success of that cohort. 3-Year total +*%& student success decreased from 61.5% to 58.9% in !$#*%& !$#!%& !'#(%& !)#(%& !"#$%& *%& the most recent cohort year. ./00&+**,1*"& ./00&+**"1*'& ./00&+**'1*)& ./00&+**)1*-& ./00&+**-1*$& 23456573893& :4/;</=>8& ?4/85@34& Benchmark Notes: • Useful benchmarks are not available to take into Data Notes: account all 3 outcomes simultaneously while tracking • The above chart includes students in programs of 1 year or on an entering cohort basis. Alternative 3-year longer. Short-term program enrollees in programs such as graduate, transfer, retention, and persistence measures Certified Nursing Assistant and the short-term EMT programs are excluded. with associated benchmarks are presented in the Since we are following students for 3 years, the most • following 4 charts. recent retention, graduation, and transfer outcome information available is for the 2008-09 cohort. The 2 charts below combine graduation and transfer outcomes for entering degree-seeking, first-time, full-time and first time, part-time student cohorts. Both full-time and part-time cohorts showed substantial increases in the % Graduated or Transferred measure. !"#$%&'%()&"*$"+$%,-.)$$)&"/,"0"1)%$-"" !"#$%&'%()&"*$"+$%,-.)$$)&"/,"0"1)%$-"" 2/$-(3+/4)5"2'663+/4)" 2/$-(3+/4)5"6%$(3+/4)" ,+%& *-%& 2.34567&86//9:9& 2/34567&86009:9& !!#'%& -;//0<=9>&-4?5@0<=9& ;/<=1>?9@&.4<5=1>?9& !+%& !-%& 47&-.//& 47&./00& '(#,%& ABB9?&C97DE=.?F& ABB9<&C97DE?/<F& '+#'%& '+%& (-%& "*#*%& )+%& "-%& +,#!%& 2433/9&C97DE=.?F& 243309&C97DE?/<F& +(#!%& *+%& +-%& !"#$%& '(#)%& !*#+%& !"#$%& "'#'%& ()#)%& +%& -%& G6H9?&C97DE=.?F& G6H9<&C97DE?/<F& -.//&)++"0+(& -.//&)++(0+1& -.//&)++10+$& ./00&"--)1-'& ./00&"--'1-,& ./00&"--,1-$& Board End #1: All students achieve the learning necessary to be successful in their educational and career goals. September, 2012 4

Download Presentation
Download Policy: The content available on the website is offered to you 'AS IS' for your personal information and use only. It cannot be commercialized, licensed, or distributed on other websites without prior consent from the author. To download a presentation, simply click this link. If you encounter any difficulties during the download process, it's possible that the publisher has removed the file from their server.

Recommend


More recommend