
SLIDE 1
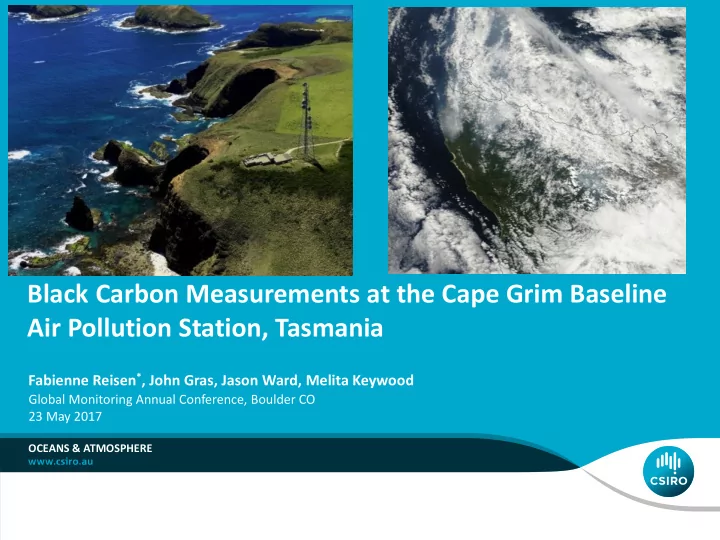
Black Carbon Measurements at the Cape Grim Baseline Air Pollution Station, Tasmania
OCEANS & ATMOSPHERE
Fabienne Reisen*, John Gras, Jason Ward, Melita Keywood
Global Monitoring Annual Conference, Boulder CO 23 May 2017
Black Carbon Measurements at the Cape Grim Baseline Air Pollution - - PowerPoint PPT Presentation
Black Carbon Measurements at the Cape Grim Baseline Air Pollution Station, Tasmania Fabienne Reisen * , John Gras, Jason Ward, Melita Keywood Global Monitoring Annual Conference, Boulder CO 23 May 2017 OCEANS & ATMOSPHERE Cape Grim Baseline
OCEANS & ATMOSPHERE
Fabienne Reisen*, John Gras, Jason Ward, Melita Keywood
Global Monitoring Annual Conference, Boulder CO 23 May 2017
Black carbon measurements at Cape Grim| Fabienne Reisen 2 |
Black carbon measurements at Cape Grim| Fabienne Reisen 3 |
Black carbon measurements at Cape Grim| Fabienne Reisen 4 |
Black carbon measurements at Cape Grim| Fabienne Reisen 5 |
Black carbon measurements at Cape Grim | Fabienne Reisen 6 |
Black carbon measurements at Cape Grim | Fabienne Reisen 7 |
2011 2013 2012 2014 2015 2017 2016 1000 2000 3000
20-21 May 7 April 22 March Jan/Feb 2016 7 April
Black carbon measurements at Cape Grim | Fabienne Reisen 8 |
Black carbon measurements at Cape Grim | Fabienne Reisen 9 |
EFBC=0.3 g/kg fuel
Black carbon measurements at Cape Grim | Fabienne Reisen 10 |
Black carbon measurements at Cape Grim | Fabienne Reisen 11 |
Black carbon measurements at Cape Grim | Fabienne Reisen 12 |
Black carbon measurements at Cape Grim | Fabienne Reisen 13 |
Black carbon measurements at Cape Grim | Fabienne Reisen 14 |
Black carbon measurements at Cape Grim | Fabienne Reisen 15 |
Black carbon measurements at Cape Grim | Fabienne Reisen 16 |
Black carbon measurements at Cape Grim | Fabienne Reisen 17 |
0.4 0.8 1.2 1.6 2
MAAP eBC (µg m-3)
2 4 6 8 10 12 14
TAP Absorption coefficient
Y = 2.60 * X + 0.081 (r2 = 0.994) Y = 4.05 * X + 0.071 r2 = 0.987 Y = 5.26 * X + 0.058 r2 = 0.976
Oceans and Atmosphere Fabienne Reisen Senior Research Scientist t +61 3 9239 4435 e fabienne.reisen@csiro.au
OCEANS AND ATMOSPHERE