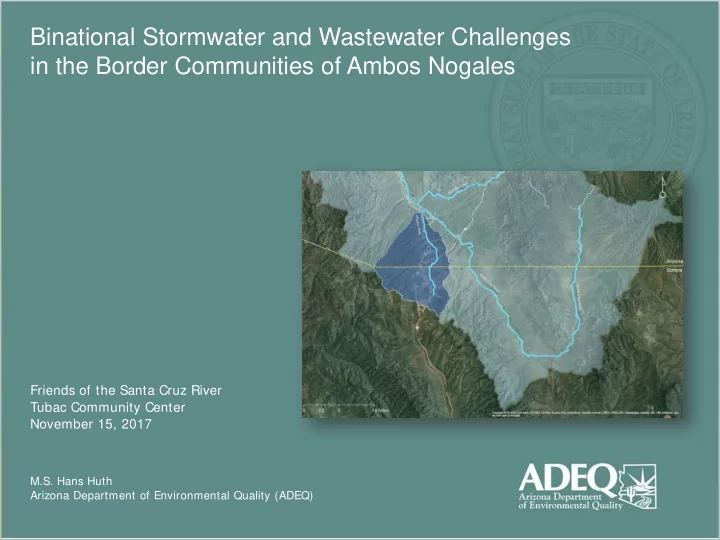
SLIDE 1 Binational Stormwater and Wastewater Challenges in the Border Communities of Ambos Nogales
Friends of the Santa Cruz River Tubac Community Center November 15, 2017
M.S. Hans Huth Arizona Department of Environmental Quality (ADEQ)
SLIDE 2
Pretreatment
Population: 300,000+ Population: 20,000+
SLIDE 3
Santa Cruz River
SLIDE 4
Pretreatment
9.62 kg Ni / day 8.36 kg Ni / day 21.19 kg Ni / day 6.27 kg Ni /day
SLIDE 5
Effluent Manhole 1
NIWTP
Influent
SLIDE 6 This image cannot currently be displayed. This image cannot currently be displayed. This image cannot currently be displayed. This image cannot currently be displayed. This image cannot currently be displayed. This image cannot currently be displayed. This image cannot currently be displayed. This image cannot currently be displayed. This image cannot currently be displayed. This image cannot currently be displayed. This image cannot currently be displayed. This image cannot currently be displayed. This image cannot currently be displayed. This image cannot currently be displayed. This image cannot currently be displayed. This image cannot currently be displayed. This image cannot currently be displayed. This image cannot currently be displayed. This image cannot currently be displayed. This image cannot currently be displayed. This image cannot currently be displayed. This image cannot currently be displayed. This image cannot currently be displayed. This image cannot currently be displayed. This image cannot currently be displayed. This image cannot currently be displayed. This image cannot currently be displayed. This image cannot currently be displayed. This image cannot currently be displayed. This image cannot curr
5 10 15 20 25 30 35 40
Total Kilograms per Day 1st QTR 2017
Figure 9: Nickel (Ni) Daily Loading NIWTP Border Station Goal Manhole 1
> 9.62 Kg / 24 hours @ 645 LPS: Impacts effluent
SLIDE 7 1 2 3
Total Kilograms per Day 1st QTR 2017
FIGURE 4: Chromium (Cr) Daily Loading NIWTP Border Station
> 1.02 Kg / 24 hours @ 645 LPS: Impacts biosolids
Goal Manhole 1
SLIDE 8 This image cannot currently be displayed. This image cannot currently be displayed. This image cannot currently be displayed. This image cannot currently be displayed. This image cannot currently be displayed. This image cannot currently be displayed. This image cannot currently be displayed. This image cannot currently be displayed. This image cannot currently be displayed. This image cannot currently be displayed. This image cannot currently be displayed. This image cannot currently be displayed. This image cannot currently be displayed. This image cannot currently be displayed. This image cannot currently be displayed. This image cannot currently be displayed. This image cannot currently be displayed. This image cannot currently be displayed. This image cannot currently be displayed. This image cannot currently be displayed. This image cannot currently be displayed. This image cannot currently be displayed. This image cannot currently be displayed. This image cannot currently be displayed. This image cannot currently be displayed. This image cannot currently be displayed. This image cannot currently be displayed. This image cannot currently be displayed. This image cannot currently be displayed. This image cannot c
2 4 6 8 10 12 14 16 18 20
Total Kilograms per Day 1st QTR 2017
FIGURE 5: Copper (Cu) Daily Loading NIWTP Border Station
> 7.65 Kg / 24 hours @ 645 LPS: Impacts effluent
Goal Manhole 1
SLIDE 9
- 1. Nickel – effluent, biosolids
- 2. Chromium – biosolids, SSOs
- 3. Copper – effluent, microbiology
In order of Importance:
SLIDE 10 Manhole #1
2009 – 2017 Quarterly Nickel Loadings (kg)
SLIDE 11 2009 – 2017 Quarterly Nickel Loadings (kg)
Manhole #1 Effluent
SLIDE 12 Nickel discharge above allowable (AZPDES – Table 1)
2009 - 2017 Daily Loadings (kg)
Manhole #1 Effluent
Nickel 38 Cyanide 7 Copper 8 DMR Exceedances 2012 - Present
SLIDE 13
LC50 is the lethal concentration required to kill 50% of the population.
* ** * **
SLIDE 14
Whole Effluent Toxicity (WET) Testing
SLIDE 15
WET Failures
SLIDE 16
2015-16 Ambient Monitoring Data
Effluent Rio Rico Bridge
SLIDE 17
IBWC Ambient Monitoring Data 2014 AZPDES Permit Requirement
SLIDE 18
IBWC Ambient Monitoring Data 2016 AZPDES Permit Requirement
SLIDE 19 “Song Sparrows (Melospiza melodia; fig. 1) provide an ideal subject for studying the extent of contaminant exposure because their non-migratory habits in the Southwest (Davis and Arcese, 1999) will mean that any contaminants they may have did not come from other locations, such as wintering grounds.”
Bio-acumulación
SLIDE 20 “Mean concentrations were highest at the NIWWTP site, most notably for Cd and Ni. Mean concentrations of Mo also were one of the highest in 2011, and Cr both years, although they did not exceed background levels. However, Cd and Ni exceeded background concentrations in Song Sparrow feathers at the treatment plant. Cadmium is a non-essential mineral that can cause bone or kidney damage when exposure is high or long
- term. Both metals are also known carcinogens (Kakkar and Jaffery, 2005). The high Cd and
Ni concentrations in feathers at the treatment plant were likely a result of industry in urban Nogales, as wastewater containing these metals was pumped from Nogales to the treatment plant.”
Bio-acumulación
SLIDE 21 Strategies
- 1. BEIF Grant Sub-agreements
SLIDE 22
SLIDE 23 Strategies
- 2. Regulated Community Engagement
October 5, 2016 November 30, 2016 May 18, 2017 September 13, 2017 Nogales, Sonora Chapter of Environmental Health Specialists Nogales Port Authority September 27, 2017 Association of Maquiladoras of Sonora – Board of Directors October 18, 2017
SLIDE 24 Strategies
- 3. Source Characterization
SLIDE 25
EPA Border 2020 Proposal for Source Characterization Strategies
SLIDE 26 Partners:
- Arizona Department of Environmental Quality (ADEQ)
- Arizona Game and Fish Department (AZGFD)
- Arizona-Mexico Commission (AMC)
- Comisión de Ecología y Desarrollo Sustentable del
Estado de Sonora (CEDES)
- Comisión Estatal del Agua del Estado de Sonora (CEA)
- Comisión Sonora-Arizona (CSA)
- Border Environment Cooperation Commission/
Comisión de Cooperación Ecológica Fronteriza (BECC/COCEF)
- North American Development Bank/ Banco de
Desarrollo del América de Norte (NADB/BANDAN)
- North American Research Partnership (NARP)
Download from – http://static.azdeq.gov/pub/obep_strat_plan.pdf
Strategies
- 4. Prioritize the Nogales Watershed
SLIDE 27 ASESP Priority Projects
Water
- Stormwater Control in Nogales,
Sonora for the Protection of Binational Infrastructure and Public Health
- Infrastructure for Metals and E. coli
Attenuation in the San Pedro River
Infrastructure in Nogales, Sonora for the Protection of Binational Stormwater Quality
- Industrial Pretreatment Support in
Nogales, Sonora for the Protection
- f Binational Water Quality
SLIDE 28
Strategies
The agencies that will be implementing the plan signed a memorandum of understanding on December 2, 2016 during a Summit of the Arizona-Mexico Commission and the Comisión Sonora-Arizona. Arizona Governor Doug Ducey and Sonora Governor Claudia Pavlovich also signed as honorary witnesses.
SLIDE 29 Strategies
- 5. Bring ELT to the Border
November 14, 2017
SLIDE 30 How are we doing?
50 100 150 200 250 300 350 400 450 500
Quarterly Loading*
(30 days monitored per quarter)
*Loadings not shown when not detected in effluent
Nickel
Updated: 9/20/2017
Kg
SLIDE 31 How are we doing?
50 100 150 200 250 300 350 400 450 500
Quarterly Loading*
(30 days monitored per quarter)
*Loadings not shown when not detected in effluent
Nickel
Updated: 9/20/2017
Kg
SLIDE 32 How are we doing?
50 100 150 200 250 300 350 400 450 500
Quarterly Loading*
(30 days monitored per quarter)
*Loadings not shown when not detected in effluent
Nickel
Updated: 9/20/2017 Min 98% = 115 Max 98% = 254
Kg
98% Confidence Interval (2nd Quarter, 2012 – 1st Quarter, 2017)
Average = 185
SLIDE 33 How are we doing?
50 100 150 200 250 300 350 400 450 500
Quarterly Loading*
(30 days monitored per quarter)
*Loadings not shown when not detected in effluent
Nickel
Updated: 9/20/2017 Min 98% = 115 Max 98% = 254
Kg
98% Confidence Interval (2nd Quarter, 2012 – 1st Quarter, 2017)
Average = 185
SLIDE 34
Strategies
SLIDE 35
SLIDE 36
Solid Waste Cleanups
10 dump truck loads collected from Nogales Wash.
SLIDE 37
Border 2012, USGS/ASU – City of Green Streets
http://server.cocef.org/Final_Reports_B2012/20044/20044_Final_Report_EN.pdf
SLIDE 38
Problemática en Prepa Municipal
SLIDE 39
Trabajos en Prepa Municipal
SLIDE 40 Modificación de Reglamentos Municipales relacionados:
La inclusión del concepto de Infraestructura Verde dentro de la Ley 254 de Ordenamiento Territorial y Desarrollo Urbano, así como de la Ley del Equilibrio Ecológico y Protección al Medio Ambiente; permitirá generar el Marco Jurídico para que los Municipios modifiquen los Reglamentos correspondientes relacionados. SITUACIÓN ACTUAL:
- En Nogales actualmente no se considera o contempla dicho concepto en
algún Reglamento Municipal.
- A partir de los proyectos implementados es evidente la importancia de
modificar algunos Reglamentos:
REGLAMENTO A LA LEY DEL EQUILIBRIO ECOLÓGICO Y PROTECCIÓN AL MEDIO AMBIENTE REGLAMENTO A LA LEY 254 DE ORDENAMIENTO TERRITORIAL Y DESARROLLO URBANO REGLAMENTO DE CONSTRUCCIÓN
- La propuesta de modificación a estos reglamentos se encuentra lista y será
enviada al Cabildo en los próximos días para su revisión y posible aprobación.
IMIP communicated that the State of Sonora now recognizes the concept of green infrastructure (GI) in state laws dealing with urban development and environmental protection. This change now provides a legal framework for municipalities in Sonora to develop their own stormwater regulations. In response, Nogales has developed a draft ordinance that includes stormwater control from new developments, which City Council will be taking under consideration “shortly”. (March 22, 2017)
SLIDE 41
On the Horizon
Photo courtesy of M.I. Claudia Gil Anaya M.U. Edgar Castellanos
SLIDE 42
On the Horizon
November 6, 2017 East of Carmen
SLIDE 43 Thank You!
M.S. Hans Huth Arizona Department of Environmental Quality (ADEQ)